

Your graphics add a nice touch to my presentations and I recently used them for one of my all-hands meetings. Your toolbox adds professionalism to my slides. Instead of using standard clipart.
Claude Jones, Director of Engineer, @Walmartlabs, USA

Your graphics add a nice touch to my presentations and I recently used them for one of my all-hands meetings. Your toolbox adds professionalism to my slides. Instead of using standard clipart.
Claude Jones, Director of Engineer, @Walmartlabs, USA
I needed a fresh look at some of my slides. I've tried to find a way to create a paintbrush effect, to underline, accentuate, add some color and the handwritten markers were just the things. Very easy to use, easy to size, change the color. It was an affordable, perfect solution and I'm happy to recommend it.
Anonymous, US
The crisp, clean look of the graphics, and the fact that it allowed me to easily edit and change the colors to match the template was my main reason for purchasing them.
Brandie Jenkins, E-learning Developer, USA
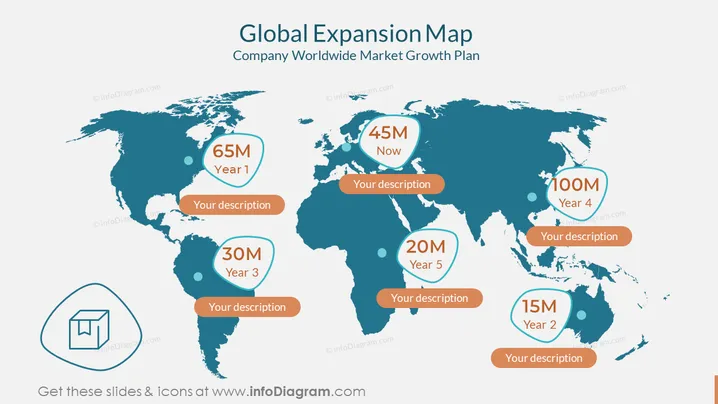
La diapositive PowerPoint illustre une stratégie d'expansion mondiale, associée aux performances projetées des Années 1 à 5 et au statut actuel étiqueté comme "Maintenant." Des chiffres indiquant des métriques de performance (65M, 45M, 100M, 30M, 20M et 15M) se superposent à une carte du monde, corrélés avec des régions géographiques spécifiques. Chaque métrique est accompagnée d'une bulle pour une description supplémentaire. Cela suggère un plan s'étendant sur plusieurs continents, avec l'objectif d'accroître la portée et l'influence du marché de l'entreprise à l'échelle mondiale. L'Année 1 commence avec 65M, indiquant une métrique telle que le chiffre d'affaires ou le nombre d'utilisateurs ; "Maintenant" est à 45M, montrant peut-être le point de départ ; 100M à l'Année 4 montre une croissance significative ; à l'Année 5, une nouvelle région commence à contribuer avec 20M.



