Your graphics add a nice touch to my presentations and I recently used them for one of my all-hands meetings. Your toolbox adds professionalism to my slides. Instead of using standard clipart.
Claude Jones, Director of Engineer, @Walmartlabs, USA
Your graphics add a nice touch to my presentations and I recently used them for one of my all-hands meetings. Your toolbox adds professionalism to my slides. Instead of using standard clipart.
Claude Jones, Director of Engineer, @Walmartlabs, USA
I needed a fresh look at some of my slides. I've tried to find a way to create a paintbrush effect, to underline, accentuate, add some color and the handwritten markers were just the things. Very easy to use, easy to size, change the color. It was an affordable, perfect solution and I'm happy to recommend it.
Anonymous, US
The crisp, clean look of the graphics, and the fact that it allowed me to easily edit and change the colors to match the template was my main reason for purchasing them.
Brandie Jenkins, E-learning Developer, USA
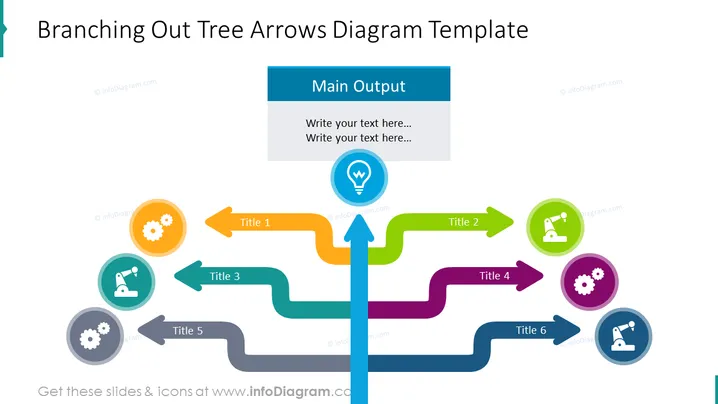
La diapositive est une représentation visuelle d'un processus de ramification ou d'une structure organisationnelle. Au centre, il y a une flèche verticale principale étiquetée "Production Principale", dont six flèches horizontales se ramifient, chacune menant à une icône circulaire avec un titre. Le Titre 1 a une icône en forme d'engrenage indiquant un mécanisme ou un processus système. Le Titre 2 présente un microscope suggérant recherche ou analyse. Les Titres 3 et 6 partagent des icônes similaires, représentant probablement la duplication ou des processus parallèles. Les Titres 4 et 5 ont également des engrenages, renforçant le thème de la machinerie ou des opérations.
La diapositive utilise des couleurs vives et des formes clairement définies pour créer un diagramme visuellement attrayant et facile à comprendre. L'utilisation d'icônes et de flèches permet de transmettre rapidement et efficacement une variété d'informations.


