

Your graphics add a nice touch to my presentations and I recently used them for one of my all-hands meetings. Your toolbox adds professionalism to my slides. Instead of using standard clipart.
Claude Jones, Director of Engineer, @Walmartlabs, USA

Your graphics add a nice touch to my presentations and I recently used them for one of my all-hands meetings. Your toolbox adds professionalism to my slides. Instead of using standard clipart.
Claude Jones, Director of Engineer, @Walmartlabs, USA
I needed a fresh look at some of my slides. I've tried to find a way to create a paintbrush effect, to underline, accentuate, add some color and the handwritten markers were just the things. Very easy to use, easy to size, change the color. It was an affordable, perfect solution and I'm happy to recommend it.
Anonymous, US
The crisp, clean look of the graphics, and the fact that it allowed me to easily edit and change the colors to match the template was my main reason for purchasing them.
Brandie Jenkins, E-learning Developer, USA
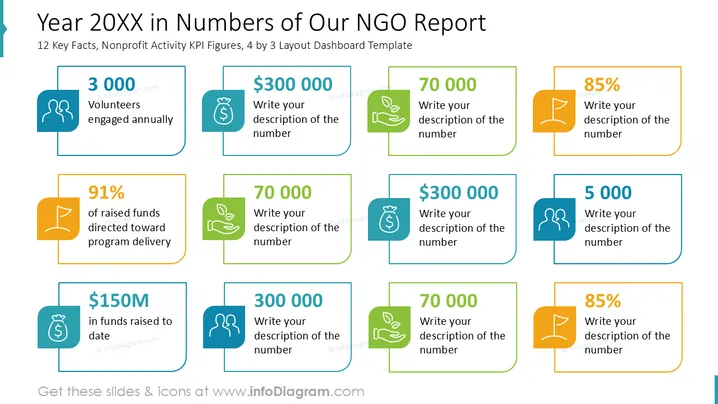
La diapositive affiche les indicateurs de performance clés (KPI) pour le rapport annuel d'une ONG. Elle met en évidence divers accomplissements tels que "3 000 bénévoles engagés annuellement", reflétant l'implication communautaire. "91 % des fonds levés dirigés vers la réalisation des programmes" montre une allocation efficace des ressources. La mention de "$150M de fonds levés à ce jour" témoigne d'un accomplissement financier. Les chiffres "70 000" et "$300 000" indiquent des mesures quantitatives spécifiques importantes pour la performance de l'ONG.
Dans l'ensemble, la diapositive utilise une mise en page structurée et visuellement attrayante, utilisant l'iconographie et la différenciation des couleurs pour souligner efficacement les points de données clés.



