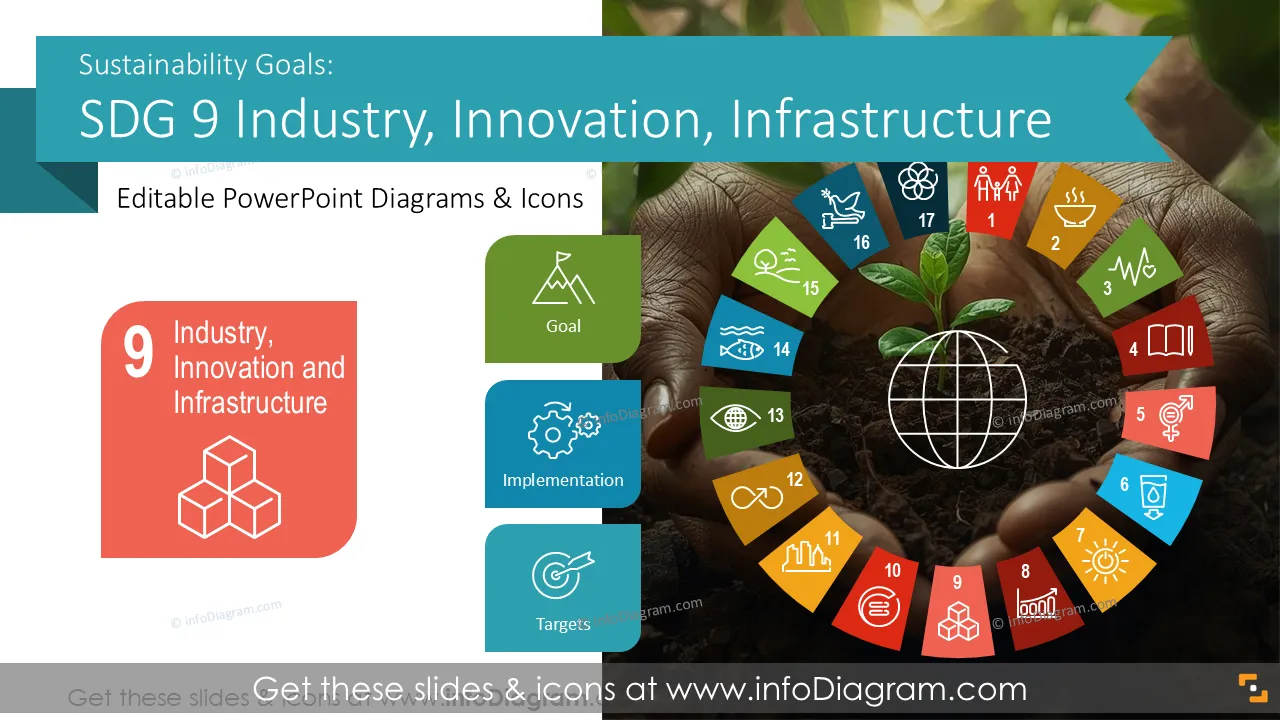
Présentez-vous votre contribution aux infrastructures résilientes, à l'innovation et au développement industriel ? Utilisez notre kit prédéfini sur les Objectifs de Développement Durable ODD 9 : Industrie, Innovation, Infrastructure, qui intègre les cibles clés, les indicateurs et des visuels de progrès de manière claire et cohérente.
Ce modèle PowerPoint ODD 9 contient :
- 17 diapositives avec des graphiques, des tableaux et des diagrammes illustrant divers enjeux liés aux thèmes de l'industrie, de l'innovation et des infrastructures
- Plus de 30 icônes illustrant les sujets de durabilité, les 17 objectifs ODD, le Travail, l'Économie, la Performance, les Finances, le Plan, la Stratégie, les Personnes, l'Énergie propre, ou d'autres concepts commerciaux généraux
- Instructions pour modifier ces diagrammes à l'aide des outils d'édition PowerPoint standard.
Ce jeu de diapositives PowerPoint est conçu dans un style professionnel avec des illustrations vectorielles colorées et des icônes linéaires. Toutes les formes graphiques peuvent être recolorées et redimensionnées sans perte de qualité.
Auteurs de ce modèle de présentation ODD
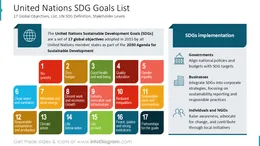
Quel est l'objectif de durabilité de l'ODD 9 ? Signification de l'objectif de durabilité pour l'Industrie, l'Innovation et l'Infrastructure :
L'ODD 9 est un Objectif de Développement Durable des Nations Unies axé sur la construction d'infrastructures résilientes, la promotion d'une industrialisation inclusive et durable, et le soutien à l'innovation. Il couvre le développement des infrastructures, la capacité de fabrication, l'adoption de technologies, ainsi que la recherche et l'innovation.
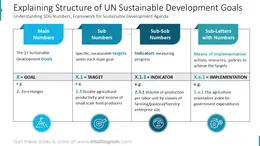
L'ODD 9 fournit un cadre structuré pour suivre la performance industrielle et d'innovation à l'aide de cibles claires et d'indicateurs mesurables.
Pourquoi utiliser un modèle visuel pour expliquer l'ODD 9 : Industrie, Innovation et Infrastructure ?
Les sujets liés à l'industrie et aux infrastructures incluent souvent des concepts techniques, des données d'investissement et des plans à long terme. Les diapositives visuelles aident à simplifier les systèmes complexes, les métriques et les dépendances :
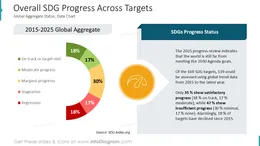
- les graphiques et les diagrammes rendent les progrès, les lacunes et les tendances plus faciles à expliquer.
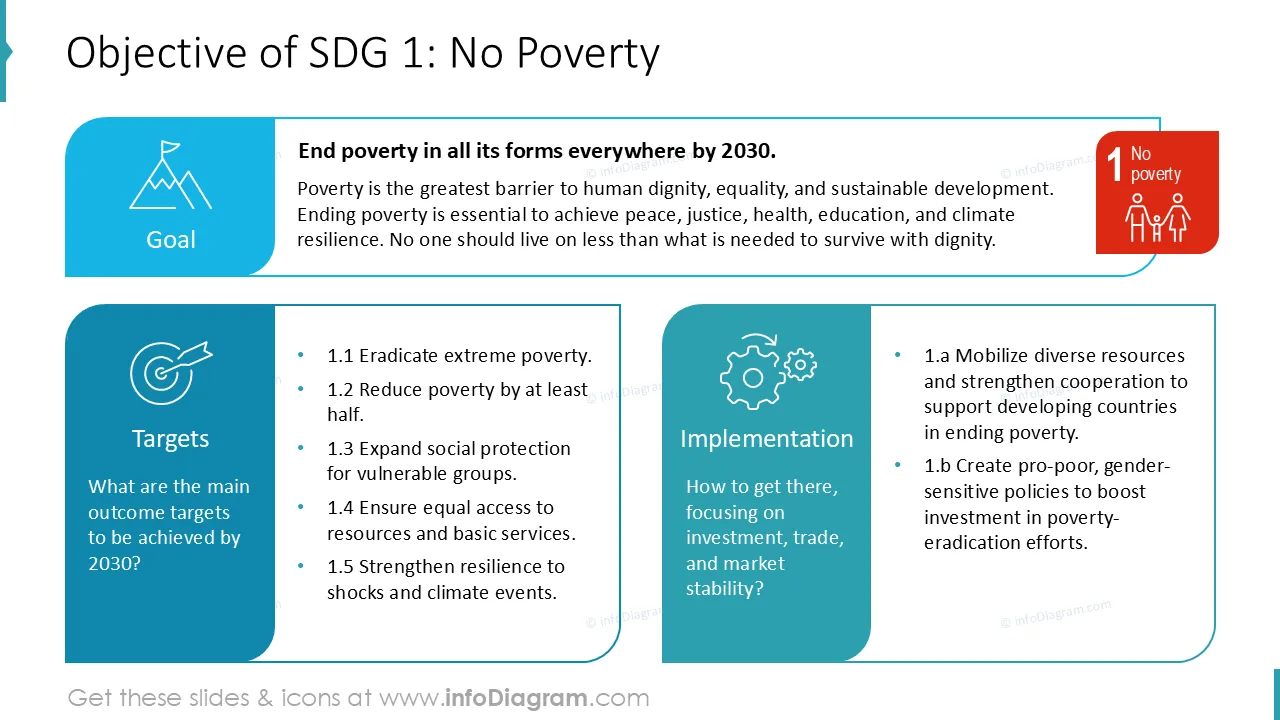
- les icônes et les mises en page structurées favorisent une communication claire des thèmes liés aux infrastructures, à l'innovation et à la croissance.
- un modèle PowerPoint cohérent garantit que le message est aligné entre les équipes, les rapports et les parties prenantes.
Les visuels prêts à l'emploi permettent de gagner du temps et d'améliorer la clarté des présentations stratégiques.
Ces modèles PowerPoint ODD préconçus vous permettent de réutiliser nos illustrations. Toutes les formes et les textes sont modifiables. Nous avons également inclus des instructions pour modifier les couleurs et le style.
Comment pouvez-vous utiliser les éléments visuels de la présentation PPT de l'ODD 9 Industrie, Innovation et Infrastructure ?
Quelques exemples où vous pouvez utiliser ce modèle de présentation ODD :
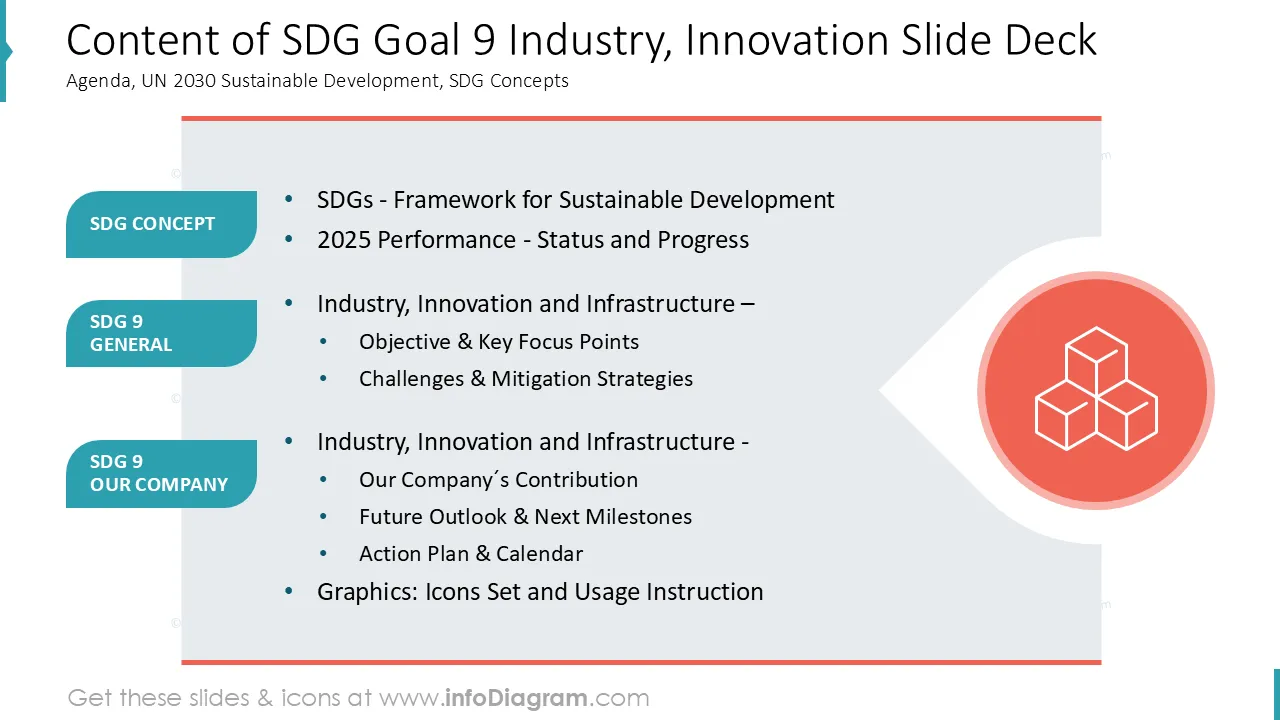
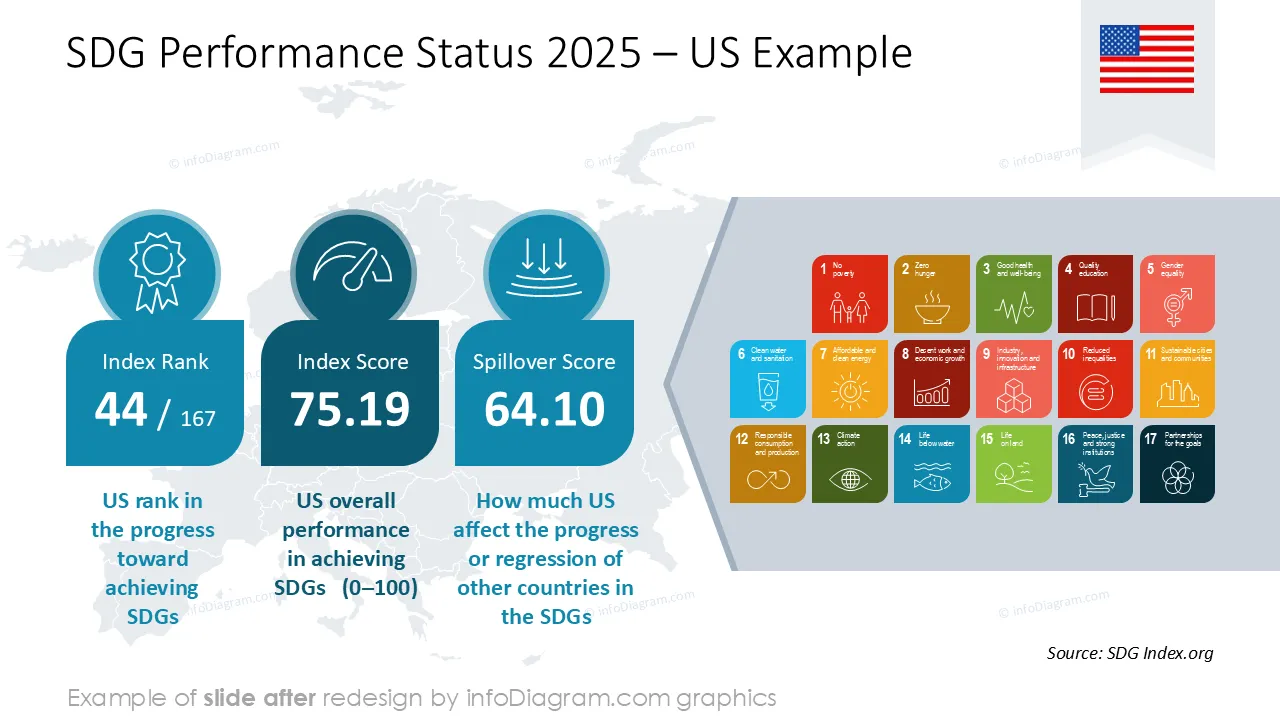
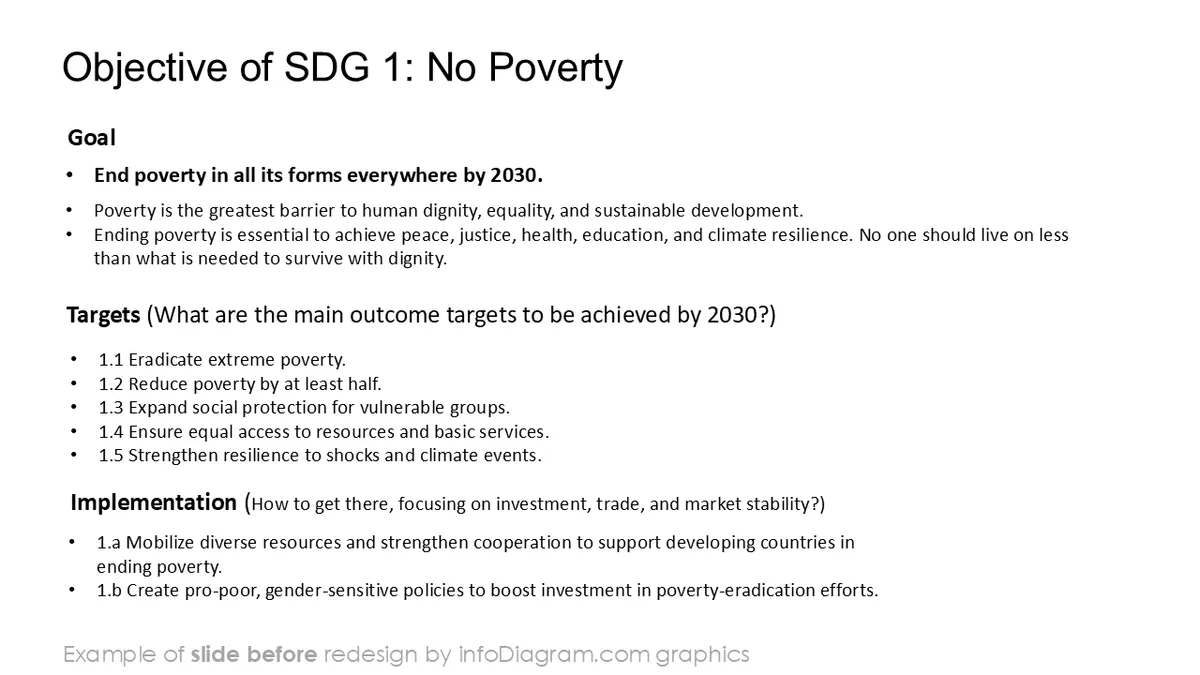
- Présenter les objectifs, les cibles et les indicateurs de l'ODD 9 dans une diapositive de synthèse claire
- Visualiser les KPI des infrastructures, de la production industrielle et de l'innovation
- Présenter les initiatives de fabrication, de digitalisation et de R&D;
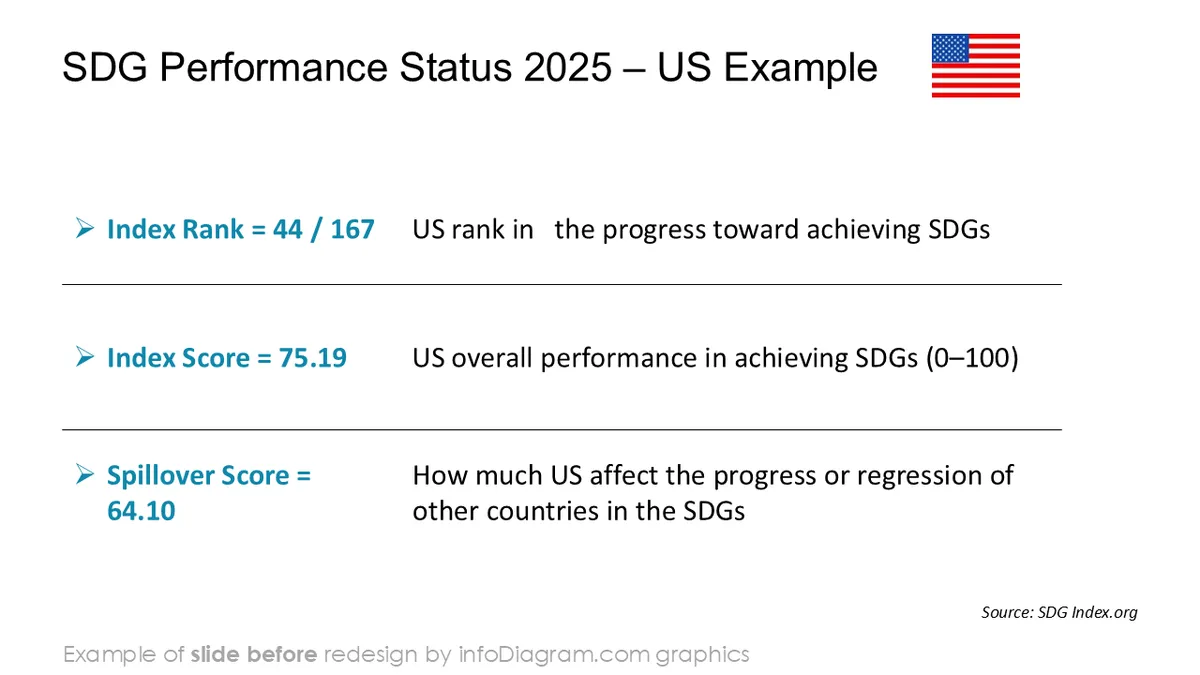
- Comparer les performances entre les régions, les secteurs ou les périodes
- Mettre en évidence les risques, les lacunes et les actions prioritaires avec des indicateurs visuels d'état
- Soutenir les rapports ESG, de durabilité ou d'impact avec des diapositives axées sur l'industrie
Tous les graphiques sont modifiables pour ajuster la taille, les couleurs et le texte. De plus, vous pouvez élargir la collection avec des symboles PPT supplémentaires (voir la section Diagrammes associés).
Vous pouvez facilement modifier tous les éléments :
- Remplacer les icônes
- Changer la couleur de remplissage et de contour
- Modifier la taille et les proportions
- Faire pivoter, retourner, aligner et changer l'ordre