Cover and narrative setup

Deck preview
This template does not have a dedicated before/after case study, so we show the strongest slides from the actual deck instead.
Cover and narrative setup

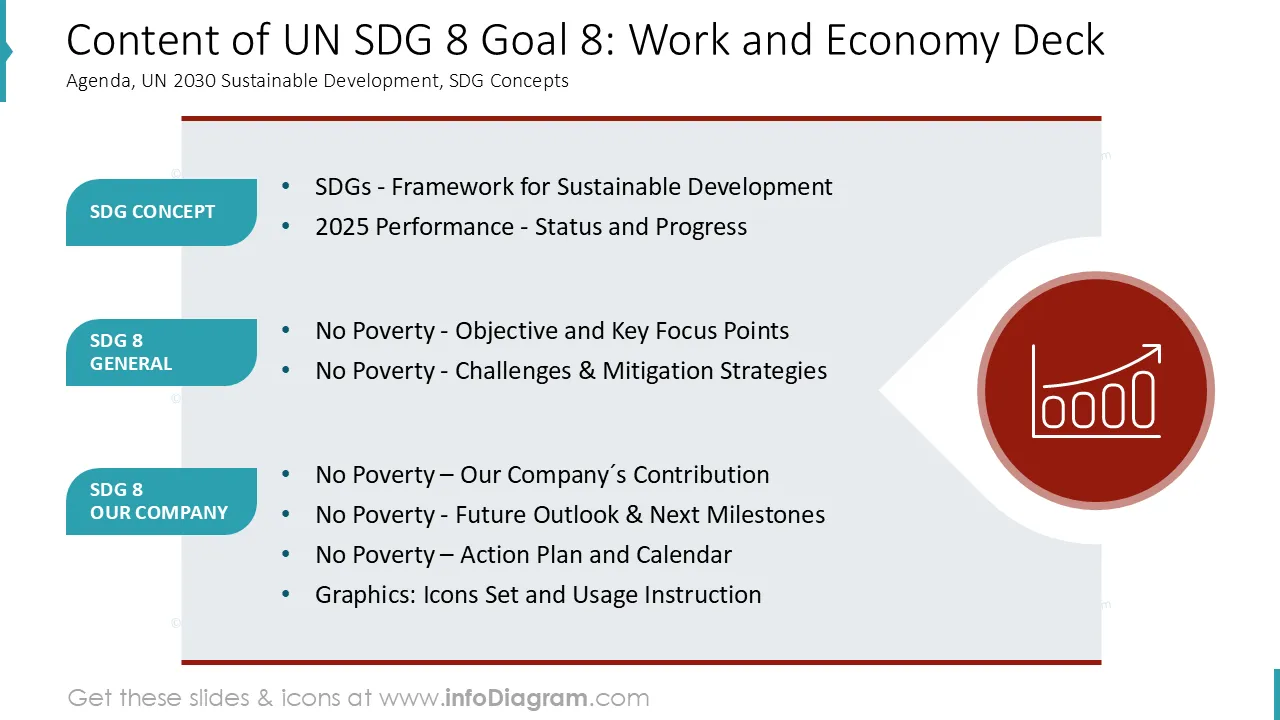
Core structure and talking points
Polished visual slide from the deck
Avez-vous besoin de présenter votre impact sur l'emploi, la productivité et la croissance économique ?
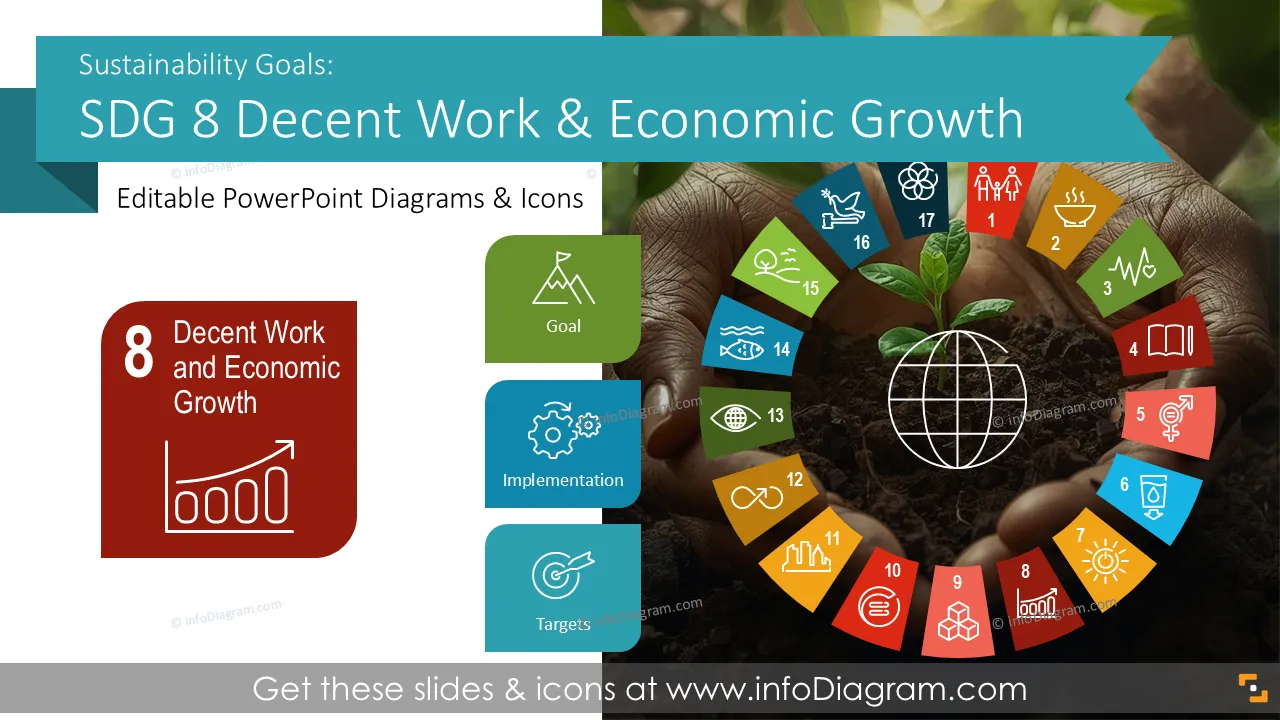
Découvrez notre modèle de présentation avec des diapositives prédéfinies sur les objectifs de développement durable (ODD) 8 Travail décent et croissance économique. Cela vous aide à afficher clairement et visuellement les indicateurs de travail, de croissance et de performance.
Ce jeu de diapositives PowerPoint est conçu dans un style plat moderne avec des illustrations vectorielles colorées et des icônes linéaires. Toutes les formes graphiques peuvent être recolorées et redimensionnées sans perte de qualité.
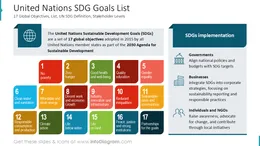
L'ODD 8 est un objectif de développement durable des Nations Unies axé sur la promotion d'une croissance économique soutenue, inclusive et durable.
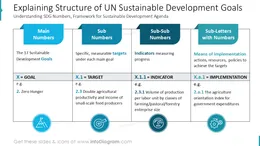
Cet objectif de l'ONU couvre les activités visant à assurer un travail décent, des conditions d'emploi, la productivité, l'entrepreneuriat et la résilience économique. L'ODD 8 fournit un cadre commun pour suivre les performances du travail et de la croissance grâce à des cibles et des indicateurs définis.
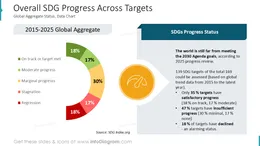
Le travail décent et les sujets de croissance économique signifient souvent la présentation d'ensembles de données sociales et financières, des explications de divers concepts économiques. Des diapositives visuelles avec des illustrations de concepts et des visualisations de données attrayantes aident à organiser les mesures de l'emploi, les tendances de croissance et les indicateurs de productivité.
L'utilisation de diagrammes rend le contenu de votre présentation ODD plus facile à comprendre. L'ajout d'icônes et l'utilisation de mises en page structurées pour les tableaux de bord favorisent une communication claire des sujets liés au travail et à la croissance. Un modèle PowerPoint cohérent maintient l'alignement des messages dans les rapports et les mises à jour des parties prenantes.
Des visuels prêts à l'emploi permettent de gagner du temps et d'améliorer la clarté des rapports ESG.
Ces modèles PowerPoint ODD 8 prédéfinis vous permettent de réutiliser rapidement nos illustrations. Toutes les formes et les textes sont modifiables. Nous avons également inclus des instructions sur la modification des couleurs et du style.
Voici plusieurs exemples de la façon dont vous pouvez utiliser ces supports visuels de présentation ODD :
Tous les graphiques sont modifiables pour modifier la taille, les couleurs et le texte. De plus, vous pouvez étendre la collection avec des symboles PPT supplémentaires (voir la section Diagrammes associés).
Vous pouvez facilement modifier tous les éléments :
Your graphics add a nice touch to my presentations and I recently used them for one of my all-hands meetings. Your toolbox adds professionalism to my slides. Instead of using standard clipart.
Claude Jones, Director of Engineer, @Walmartlabs, USA
I needed a fresh look at some of my slides. I've tried to find a way to create a paintbrush effect, to underline, accentuate, add some color and the handwritten markers were just the things. Very easy to use, easy to size, change the color. It was an affordable, perfect solution and I'm happy to recommend it.
Anonymous, US
The crisp, clean look of the graphics, and the fact that it allowed me to easily edit and change the colors to match the template was my main reason for purchasing them.
Brandie Jenkins, E-learning Developer, USA


Vous pourriez aussi avoir besoin de