
Cover and narrative setup
Deck preview
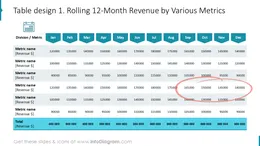
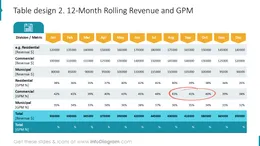
This template does not have a dedicated before/after case study, so we show the strongest slides from the actual deck instead.
Cover and narrative setup
Core structure and talking points
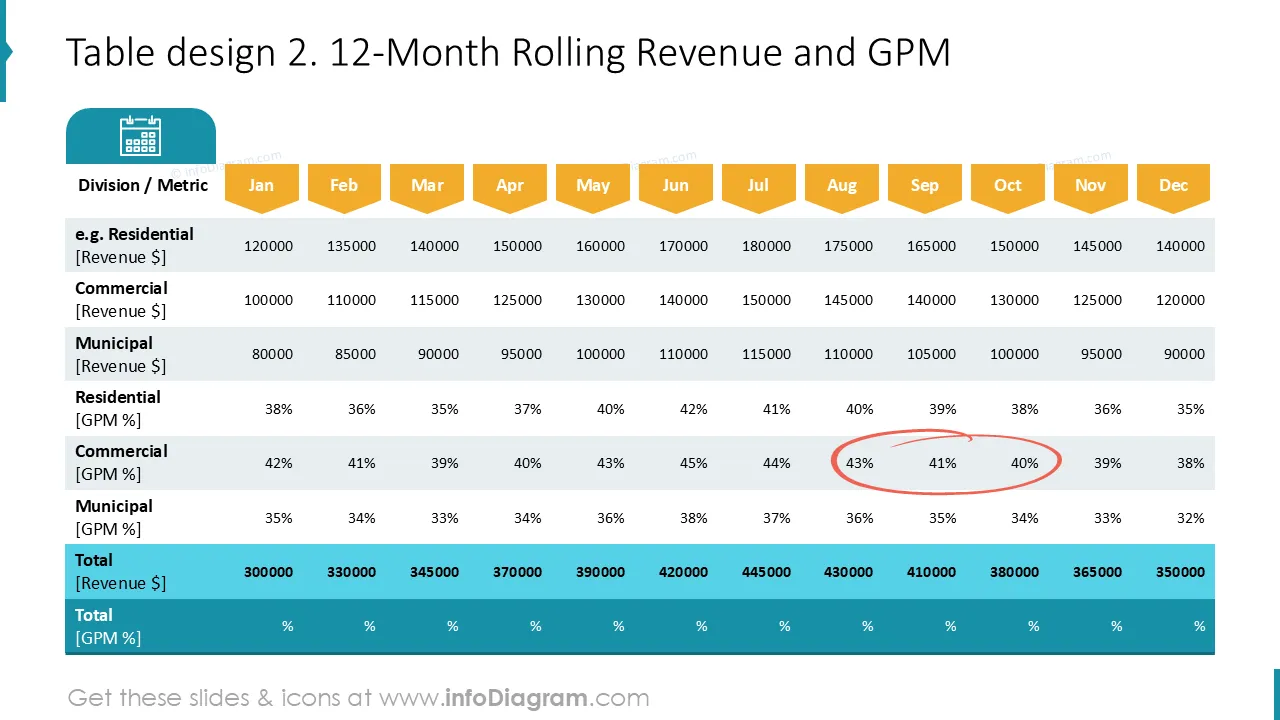
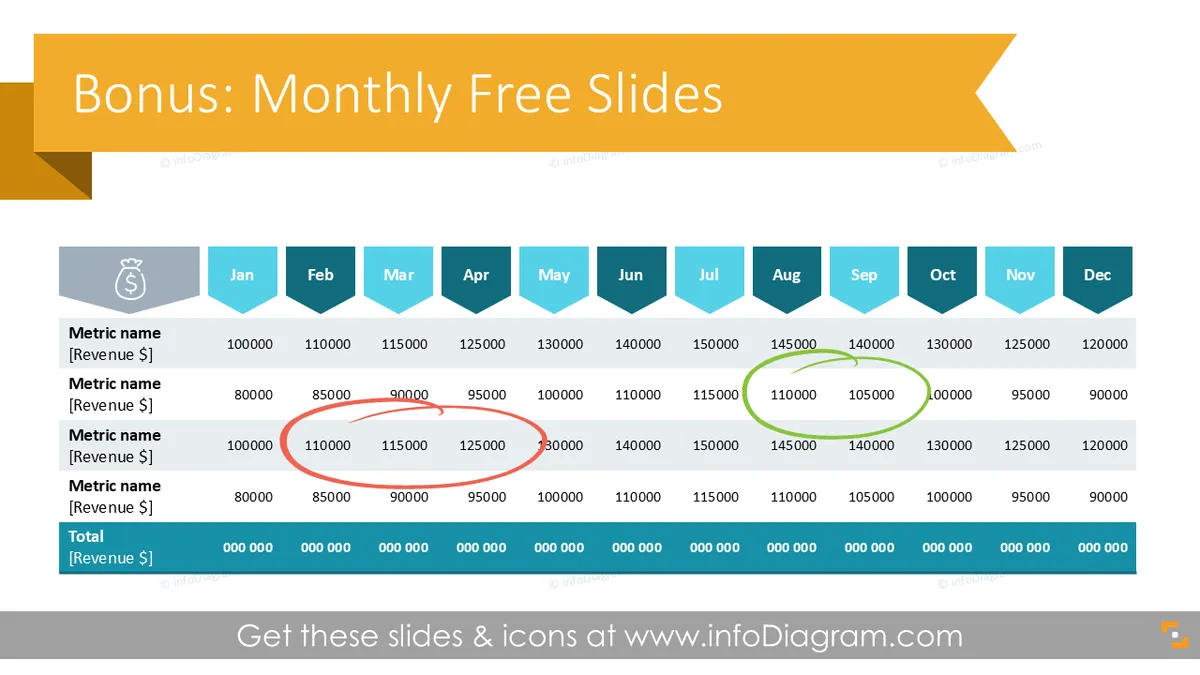
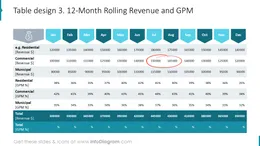
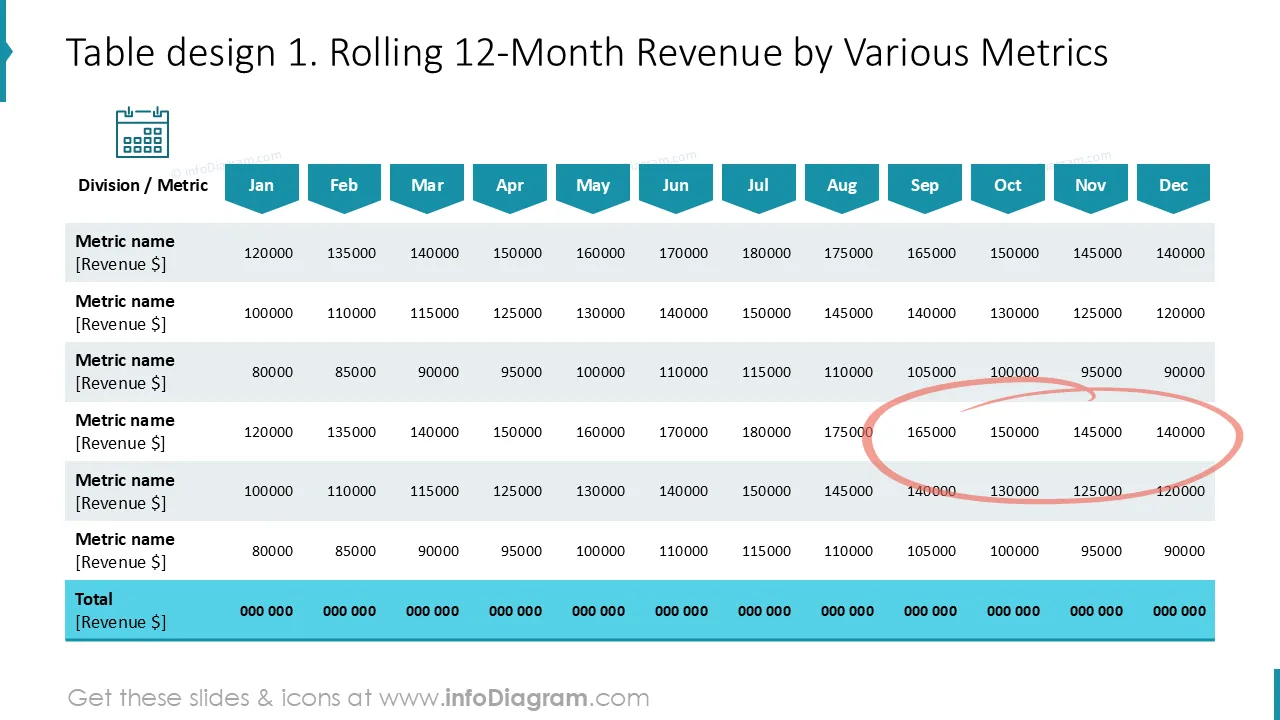
Polished visual slide from the deck
Salut ! Nous espérons que nos diapositives bonus vous aideront à trouver des moyens clairs et créatifs de partager des données complexes. Raconter l'histoire de manière graphique présente de nombreux avantages, et nous voulons vous soutenir dans cela : diapositive par diapositive :)
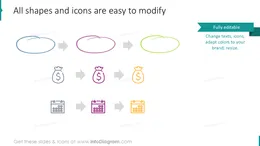
Vous pouvez facilement personnaliser ces diapositives selon vos besoins : les couleurs, les icônes et les arrière-plans peuvent être modifiés à l'aide d'outils standards.
Si vous avez des commentaires et/ou des questions, ou si vous voulez simplement dire bonjour, contactez-nous : ici
Your graphics add a nice touch to my presentations and I recently used them for one of my all-hands meetings. Your toolbox adds professionalism to my slides. Instead of using standard clipart.
Claude Jones, Director of Engineer, @Walmartlabs, USA
I needed a fresh look at some of my slides. I've tried to find a way to create a paintbrush effect, to underline, accentuate, add some color and the handwritten markers were just the things. Very easy to use, easy to size, change the color. It was an affordable, perfect solution and I'm happy to recommend it.
Anonymous, US
The crisp, clean look of the graphics, and the fact that it allowed me to easily edit and change the colors to match the template was my main reason for purchasing them.
Brandie Jenkins, E-learning Developer, USA


Vous pourriez aussi avoir besoin de