

Your graphics add a nice touch to my presentations and I recently used them for one of my all-hands meetings. Your toolbox adds professionalism to my slides. Instead of using standard clipart.
Claude Jones, Director of Engineer, @Walmartlabs, USA

Your graphics add a nice touch to my presentations and I recently used them for one of my all-hands meetings. Your toolbox adds professionalism to my slides. Instead of using standard clipart.
Claude Jones, Director of Engineer, @Walmartlabs, USA
I needed a fresh look at some of my slides. I've tried to find a way to create a paintbrush effect, to underline, accentuate, add some color and the handwritten markers were just the things. Very easy to use, easy to size, change the color. It was an affordable, perfect solution and I'm happy to recommend it.
Anonymous, US
The crisp, clean look of the graphics, and the fact that it allowed me to easily edit and change the colors to match the template was my main reason for purchasing them.
Brandie Jenkins, E-learning Developer, USA
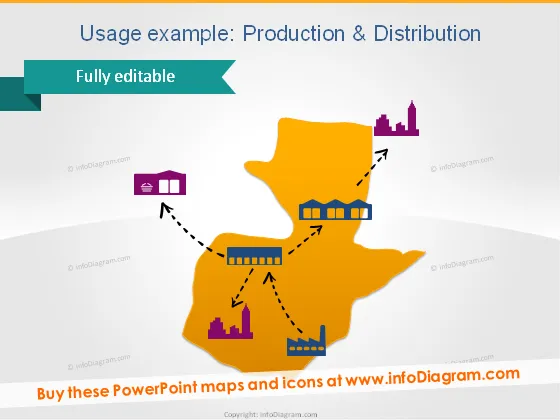
La diapositiva ilustra el concepto de Producción y Distribución dentro de un contexto geográfico utilizando un mapa estilizado y iconos. El mapa parece representar una región abstracta con conexiones entre una fábrica, un almacén y un gráfico de barras indicativo de métricas de rendimiento. Cada icono (fábrica, almacén y gráfico de rendimiento) simboliza una etapa o componente en el proceso de producción y distribución. La fábrica probablemente representa la fase de manufactura, el almacén significa almacenamiento o logística, y el gráfico de barras puede indicar resultados de ventas o distribución.
La apariencia general de la diapositiva es moderna y empresarial, con una paleta de colores simple pero impactante que capta la atención. El uso de formas e iconos distintos hace que la diapositiva sea fácil de entender de un vistazo.



