Your graphics add a nice touch to my presentations and I recently used them for one of my all-hands meetings. Your toolbox adds professionalism to my slides. Instead of using standard clipart.
Claude Jones, Director of Engineer, @Walmartlabs, USA
Your graphics add a nice touch to my presentations and I recently used them for one of my all-hands meetings. Your toolbox adds professionalism to my slides. Instead of using standard clipart.
Claude Jones, Director of Engineer, @Walmartlabs, USA
I needed a fresh look at some of my slides. I've tried to find a way to create a paintbrush effect, to underline, accentuate, add some color and the handwritten markers were just the things. Very easy to use, easy to size, change the color. It was an affordable, perfect solution and I'm happy to recommend it.
Anonymous, US
The crisp, clean look of the graphics, and the fact that it allowed me to easily edit and change the colors to match the template was my main reason for purchasing them.
Brandie Jenkins, E-learning Developer, USA
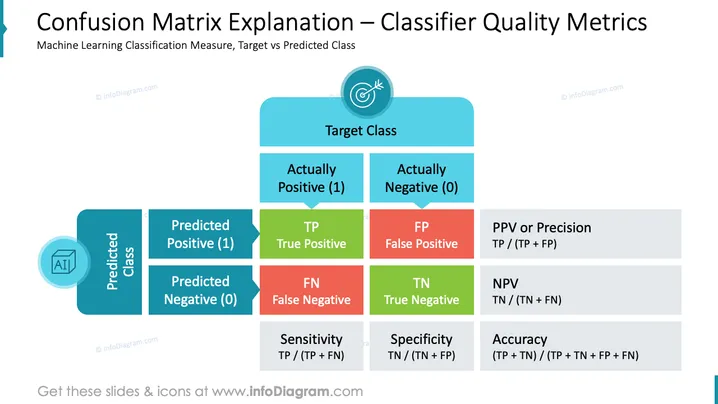
La diapositiva titulada "Explicación de la Matriz de Confusión – Métricas de Calidad del Clasificador" presenta un concepto fundamental en el aprendizaje automático, específicamente en la evaluación de modelos de clasificación. Explica una matriz de confusión, una tabla que se utiliza a menudo para evaluar el rendimiento de un algoritmo de clasificación. Desglosa las predicciones en cuatro categorías: Verdadero Positivo (TP), Falso Positivo (FP), Verdadero Negativo (TN) y Falso Negativo (FN). Cada categoría representa un tipo diferente de resultado de predicción. La diapositiva también muestra métricas derivadas como el Valor Predictivo Positivo (Precisión), el Valor Predictivo Negativo (VPN), Sensibilidad, Especificidad y Precisión, que son esenciales para comprender el rendimiento del clasificador.


