

Cover and narrative setup

Deck preview
This template does not have a dedicated before/after case study, so we show the strongest slides from the actual deck instead.
Cover and narrative setup
Core structure and talking points
Polished visual slide from the deck
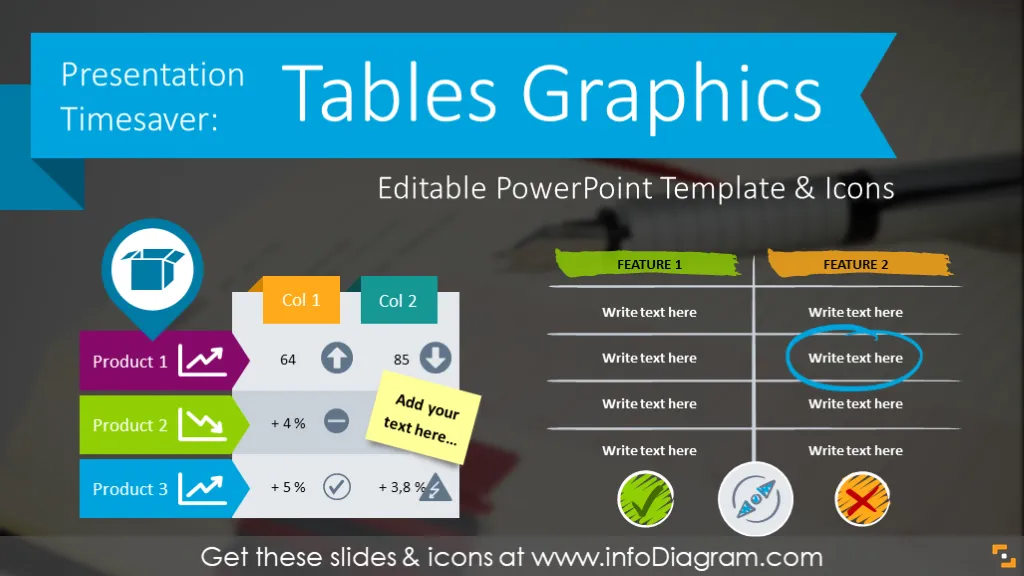
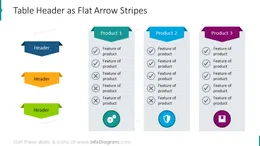
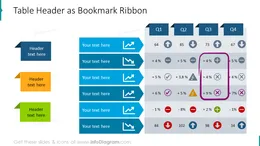
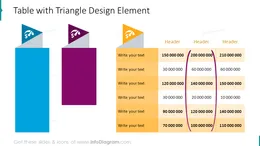
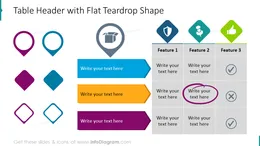
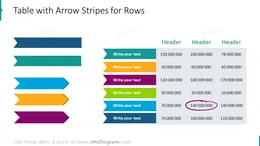
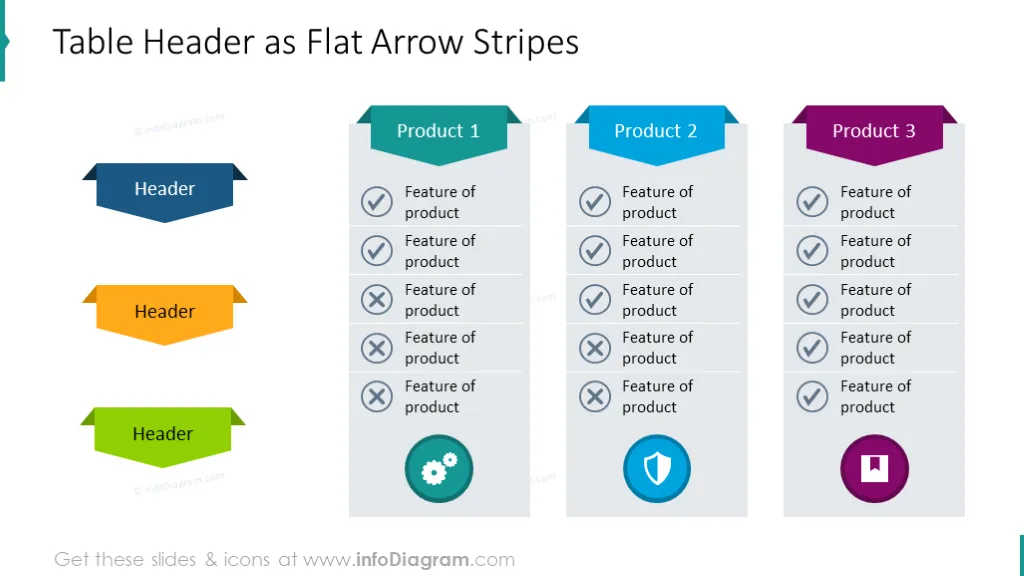
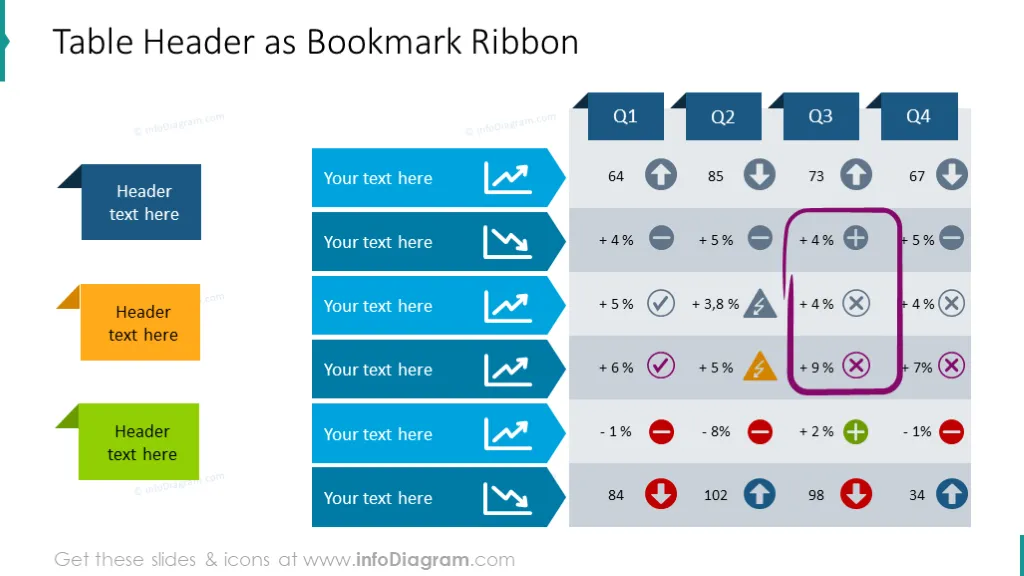
Creative presentation timesaver slide deck with PowerPoint templates for tables. Use one of table add-on graphics to design attractive looking modern tables to present financial charts or text comparisons. This editable PPT graphics includes.
Presentation timesaver diagram contains pre-designed slide templates:
Presentation timesaver tables will help you to make your presentation look more professional and visually attractive. You can use table graphics to show any comparison you need: e.g. the benefits of your premium offering over the standard plan. Using tables you can also highlight differences between discussed points. Fully editable tables will help you to save your time and create eye-catchy, easier to read and remember slides.
You can copy the table graphics and modify them as you need (resize, change colors to your brand ones). A few ideas where you can apply those illustrations:
All shapes can be edited using PowerPoint set of vector shapes fully editable by using built-in PPT tools, including
See editing demonstration in our HowTo Videos.
Vos graphiques ajoutent une belle touche à mes présentations et je les ai récemment utilisés pour l'une de mes réunions générales. Votre boîte à outils ajoute du professionnalisme à mes diapositives. Au lieu d'utiliser des cliparts standards.
Claude Jones, Directeur de l'ingénierie, @Walmartlabs, USA
J'avais besoin d'un nouveau regard sur certaines de mes diapositives. J'ai essayé de trouver un moyen de créer un effet de pinceau, de souligner, d'accentuer, d'ajouter de la couleur et les marqueurs manuscrits étaient exactement ce qu'il fallait. Très facile à utiliser, facile à ajuster la taille, à changer la couleur. C'était une solution abordable et parfaite et je suis heureux de la recommander.
Anonymous, US
L'aspect net et épuré des graphiques, et le fait qu'il m'ait permis d'éditer et de changer facilement les couleurs pour les adapter au modèle, ont été les principales raisons de mon achat.
Brandie Jenkins, Développeur E-learning, USA


You may also need