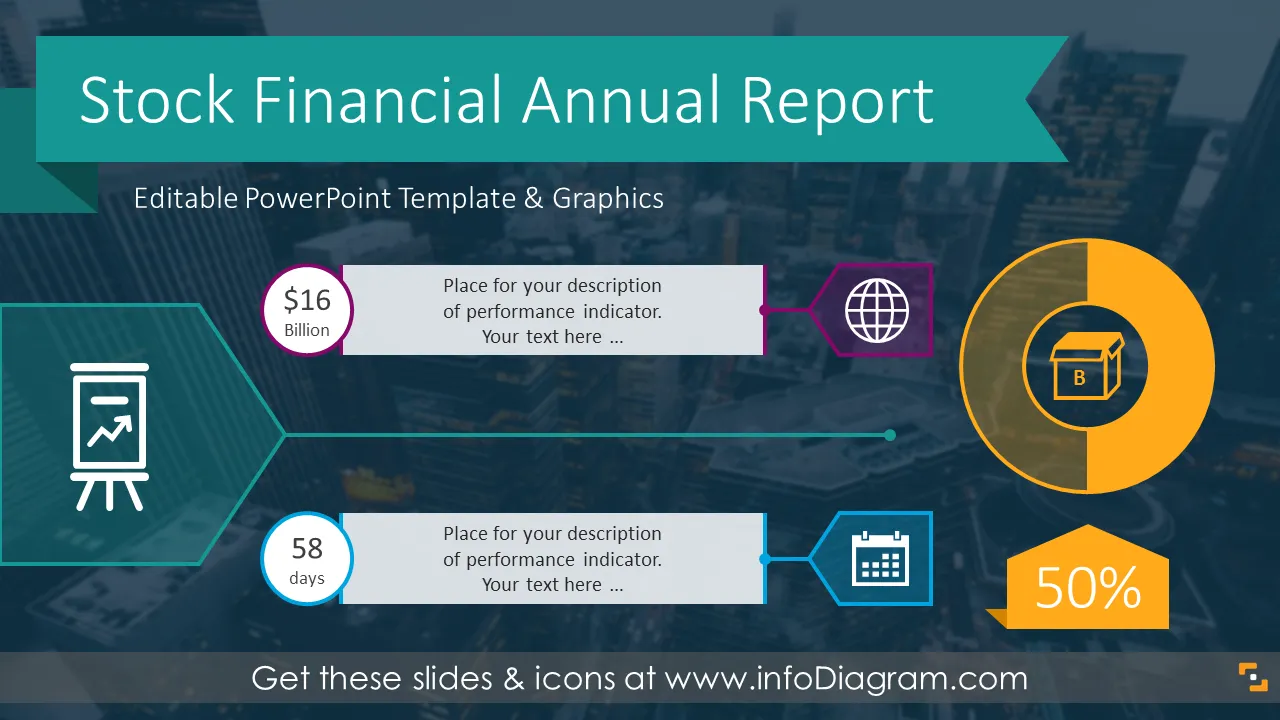
Are you presenting annual company performance for a Stock exchange or other type of investors report? Check this PowerPoint template with basic components covering key financial and sales information, We’ve added presentation slides to show executive leadership - board members, advisors, office locations, and basic legal information needed for SEC reporting.
You can find inside this stock PPT predefined graphical templates with visual that helps you to create a professional report or presentation:
- 17 slide layouts with text placeholders and graphics for presenting key financial and performance indicators such as net sales, operating income or total equity, charts to show store count over time or earnings per share
- 36 symbols in a simple flat style, that you can use to explain visually concepts such as objectives, status, measures, strategy, operations, finance, HR, and IT
- over 50 countries and states editable outline maps, to show company representation globally, nationally (in the US), and in the North American continent
Format: fully editable vector shapes (modify colors of diagrams and icons, resize without quality loss.
What are the components of an annual report?
Yearly Stock financial reports can have this structure:
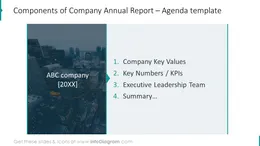
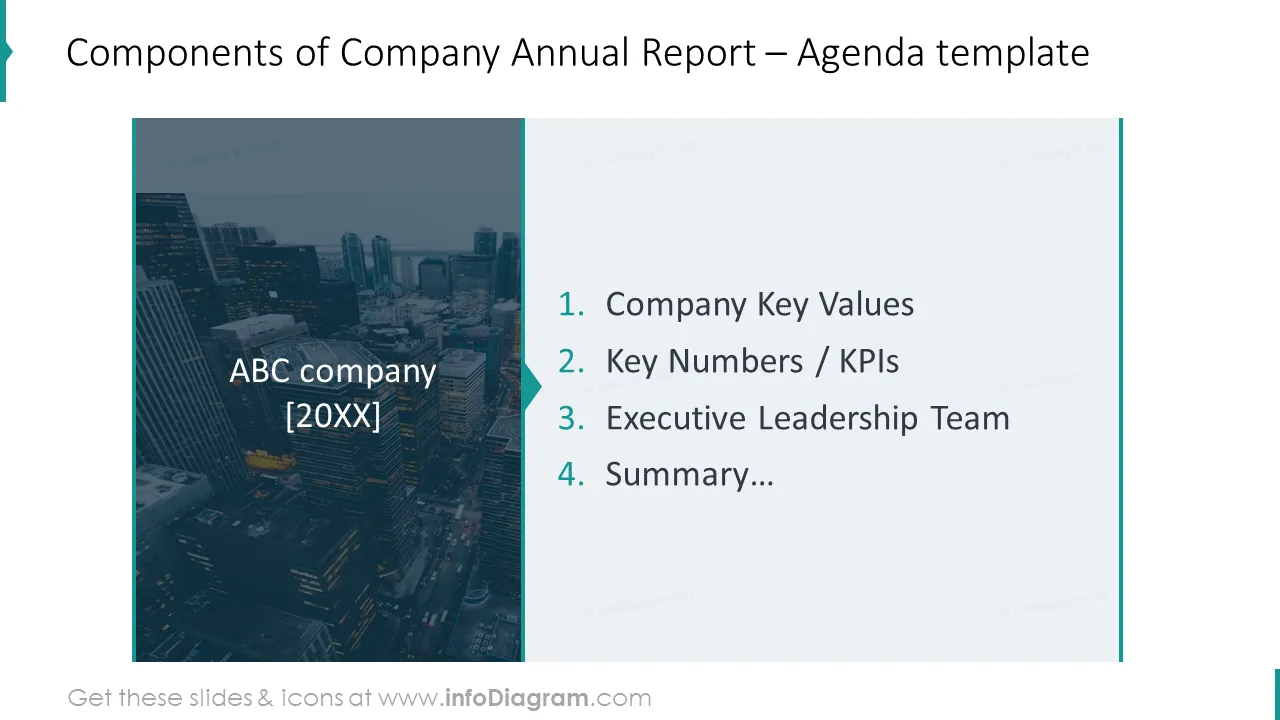
- Annual Report title slide and agenda presenting the items covered by the report
- Key company values, main product sales, and financial data tables presentation
- Executive Leadership of the company - overview of people (board members) managing and supervising the company.
- Company's main historical events timeline covering all major achievements over the last years.
- Template slides for Market relevance statements, success ingredients
- Pre-designed Financial Tables with main fiscal data
- Data charts of product sales over the years, stores growth on a national or international level, as well as Earning per Share information.
- Legal information one-pages with contacts to media and investor relations, forward-looking statements, and disclaimers.
- World and US maps to show the location of company offices, headquarters, or other activities.
Why use this visual template?
Ensure a professional corporate look and clear information structure. We added light illustrations for key terms in the report to make it easier to read. The photographs in the slides' background create a look of a representative document, not only a plain presentation.
In the last part of this deck, we added a set of icons you can use instead of icons in slide examples. You can extend these symbols icon collection by getting more flat business icons (see Related Diagrams section).
The colors of all text placeholders, text graphics, and icons are fully editable (all graphics are vector format). So you can change them to colors of your template or company brand.
Content description:
Stock Financial Annual Report diagram contains ready-to-use slides:
- Financial report title slide on a dark picture background;
- Company annual report agenda;
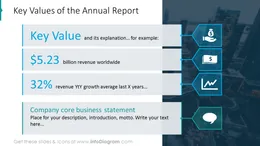
- Key values of the annual report, shown with list description and icons;
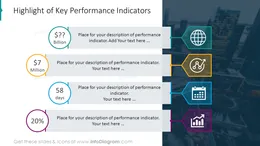
- Key performance indicators list diagram with icons;
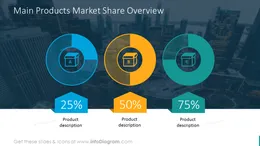
- Main market products, shown with circle diagrams with values and colorful symbols;
- Team presentation template with a description of each member;
- Company history journey slide illustrated with the road graphics timeline and description;
- Market and customer relevance statements diagram, shown with text placeholders and icons;
- Major company success ingredients presented with list descriptions and icons;
- Annual financial summary illustrated with a colorful table with icons;
- Annual financial summary table on a picture background with symbols;
- The financial growth bar chart on a picture background with values;
- Yearly earning per share bar chart on a picture background with description;
- Net sales of top products over the years slide shown with bar chart and values on a picture background;
- World map with marked company offices and text description;
- The national representation of the United States, shown with a country map and company offices;
- Regional representation of North America illustrated with map and list description;
- Legal information template with place for a text description: corporate headquarters, board of directors, independent public account, transfer agent;
- Legal information template with text placeholders and icons for each item: investor relations, media relations, forward-looking statement, and a disclaimer.
Fully editable in PowerPoint set of vector shapes fully editable by using built-in PowerPoint tools, including
- changing the color of the icon filling and its outline
- adding shadows
- changing shape and size, rotating, flipping the object
- putting shapes behind or on top of text
See editing demonstration in our HowTo Videos.
Authors
- infoDiagram's designer
- Contact: here
Slides included in this PowerPoint Presentation:
- Financial report title slide on a dark background
- Company report agenda on a dark picture background
- Key values of the annual report shown with list description and icons
- KPI Stock Market Highlights Presentation
- Market Share Slide With Graphics
- Team presentation template with a description of each member and icons
- Company journey slide illustrated with the road graphics timeline and description
- Market and customer relevance statements diagram with icons
- Business Success Metrics Presentation - Four Key Factors
- Annual financial summary colorful table with icons
- Financial summary table on a picture background with icons
- The financial growth bar chart on a picture background with values
- Earnings per Share PPT - Bar Chart Graphics
- Top products over years bar chart with values on a picture background
- World map with marked company offices and text description
- National representation: US map with company offices
- North America map with list description and icons
- Legal information template with text placeholders and icons
- Legal information presented with flat style graphics
- Financial report chart
- Editability of flat financial icons
- Flat Icons: Products, Product, Sales, Growth, Improvement, Showcase
- Icons set: Finance, Communication, Bank, Businessman, Speech Bubble
- Flat Icons: launch, notes, cards, innovation, creative thinking, retail, monitor