

Your graphics add a nice touch to my presentations and I recently used them for one of my all-hands meetings. Your toolbox adds professionalism to my slides. Instead of using standard clipart.
Claude Jones, Director of Engineer, @Walmartlabs, USA

Your graphics add a nice touch to my presentations and I recently used them for one of my all-hands meetings. Your toolbox adds professionalism to my slides. Instead of using standard clipart.
Claude Jones, Director of Engineer, @Walmartlabs, USA
I needed a fresh look at some of my slides. I've tried to find a way to create a paintbrush effect, to underline, accentuate, add some color and the handwritten markers were just the things. Very easy to use, easy to size, change the color. It was an affordable, perfect solution and I'm happy to recommend it.
Anonymous, US
The crisp, clean look of the graphics, and the fact that it allowed me to easily edit and change the colors to match the template was my main reason for purchasing them.
Brandie Jenkins, E-learning Developer, USA
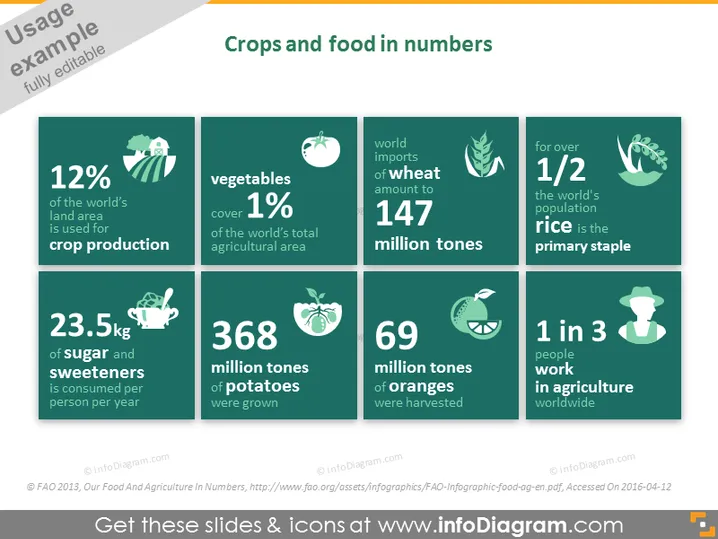
Diese PowerPoint-Folie mit dem Titel "Pflanzen und Ernährung in Zahlen" präsentiert statistische Daten zur globalen Landwirtschaft und Nahrungsmittelkonsum. Sie ist in sechs Abschnitte mit einzelnen Statistiken unterteilt. "12% der Landfläche der Welt werden für den Anbau von Pflanzen genutzt" weist darauf hin, dass ein kleiner Teil des globalen Landes landwirtschaftlich genutzt wird. Gemüse nimmt "1% der gesamten landwirtschaftlichen Fläche der Welt" ein, was ihren relativ geringen Flächenverbrauch darstellt. Der Hinweis "23,5 kg Zucker und Süßstoffe pro Person und Jahr konsumiert" deutet auf hohe Konsumraten hin. "368 Millionen Tonnen Kartoffeln wurden angebaut" und "69 Millionen Tonnen Orangen wurden geerntet" geben Aufschluss über das Produktionsvolumen dieser Pflanzen. Die Folie schließt mit "147 Millionen Tonnen", was die globalen Weizenimporte anzeigt, sowie zwei Verhältnissen: "1/2", was bedeutet, dass über die Hälfte der Bevölkerung auf Reis als Grundnahrungsmittel angewiesen ist und "1 von 3 Menschen weltweit in der Landwirtschaft beschäftigt ist", was die Bedeutung des Sektors für die Beschäftigung hervorhebt.
Die Folie hat ein sauberes und professionelles Aussehen, wobei die Statistiken aufgrund des starken Farbkontrasts und des großen Textes leicht lesbar sind. Die Icons sind gut gewählt, um jede entsprechende Statistik in intuitiver Weise visuell darzustellen.



