
Your graphics add a nice touch to my presentations and I recently used them for one of my all-hands meetings. Your toolbox adds professionalism to my slides. Instead of using standard clipart.
Claude Jones, Director of Engineer, @Walmartlabs, USA

Your graphics add a nice touch to my presentations and I recently used them for one of my all-hands meetings. Your toolbox adds professionalism to my slides. Instead of using standard clipart.
Claude Jones, Director of Engineer, @Walmartlabs, USA

I needed a fresh look at some of my slides. I've tried to find a way to create a paintbrush effect, to underline, accentuate, add some color and the handwritten markers were just the things. Very easy to use, easy to size, change the color. It was an affordable, perfect solution and I'm happy to recommend it.
Anonymous, US
The crisp, clean look of the graphics, and the fact that it allowed me to easily edit and change the colors to match the template was my main reason for purchasing them.
Brandie Jenkins, E-learning Developer, USA
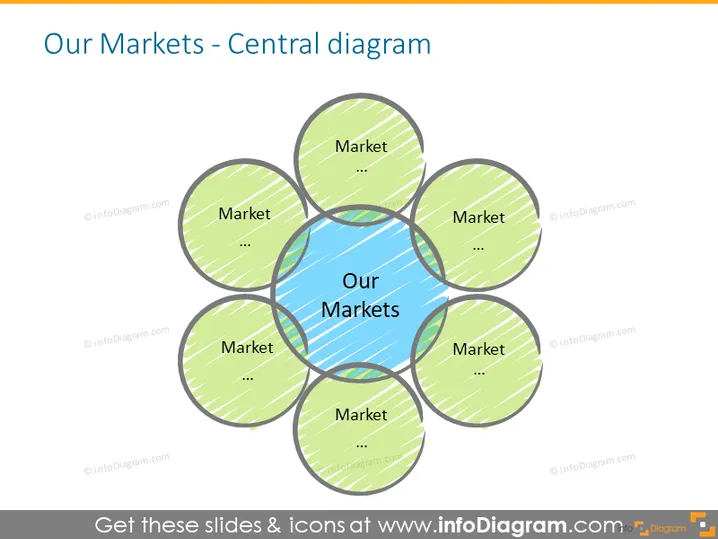
Die Folie mit dem Titel "Unsere Märkte - Zentrales Diagramm" scheint die Marktpräsenz eines Unternehmens zu präsentieren. Die zentrale Figur, die in Blau hervorgehoben ist, trägt die Bezeichnung "Unsere Märkte", was auf einen Fokus auf die Bereiche hinweist, in denen das Unternehmen derzeit tätig ist. Sie wird von sieben grünen Kreisen umgeben, die jeweils mit "Markt" beschriftet sind, wobei Ellipsen auf weitere Details oder Kategorisierungen hinweisen, was potenzielle oder bestehende Marktsegmente oder geografische Bereiche symbolisiert, in denen das Unternehmen ein Interesse oder eine Beteiligung hat.
Die Folie ist visuell ausgewogen mit einer symmetrischen Anordnung der kreisförmigen Grafiken um ein zentrales Sechseck, was ein harmonisches und professionelles Erscheinungsbild bietet. Die Verwendung von kontrastierenden Farben (grün und blau) schafft eine effektive visuelle Unterscheidung zwischen dem zentralen Markt und den umliegenden Märkten.


