Your graphics add a nice touch to my presentations and I recently used them for one of my all-hands meetings. Your toolbox adds professionalism to my slides. Instead of using standard clipart.
Claude Jones, Director of Engineer, @Walmartlabs, USA
Your graphics add a nice touch to my presentations and I recently used them for one of my all-hands meetings. Your toolbox adds professionalism to my slides. Instead of using standard clipart.
Claude Jones, Director of Engineer, @Walmartlabs, USA
I needed a fresh look at some of my slides. I've tried to find a way to create a paintbrush effect, to underline, accentuate, add some color and the handwritten markers were just the things. Very easy to use, easy to size, change the color. It was an affordable, perfect solution and I'm happy to recommend it.
Anonymous, US
The crisp, clean look of the graphics, and the fact that it allowed me to easily edit and change the colors to match the template was my main reason for purchasing them.
Brandie Jenkins, E-learning Developer, USA
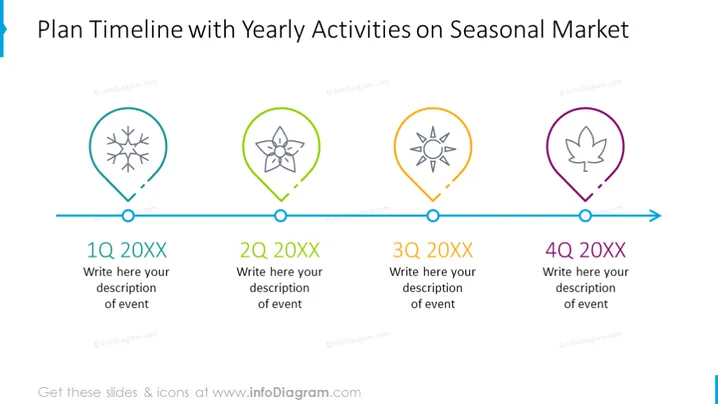
Die PowerPoint-Folie "Plan Zeitachse mit jährlichen Aktivitäten auf dem saisonalen Markt" unterteilt eine Zeitachse in vier Quartale und zeigt verschiedene saisonale Aktivitäten an. Q1 20XX entspricht einem Schneeflockensymbol, was auf ein Winterereignis hindeutet. Q2 20XX zeigt ein Blumen-Icon, das auf Frühlingsaktivitäten hinweist. Q3 20XX beinhaltet ein Sonnenbild, das wahrscheinlich den Sommer repräsentiert. Und Q4 20XX zeigt ein Blattesymbol, das auf Herbstveranstaltungen verweist. Jedes Quartal bietet Platz für eine individuelle Beschreibung von Ereignissen und zeigt die saisonale Natur der geplanten Aktivitäten.
Die Folie weist ein sauberes und professionelles Design mit einem farbcodierten System auf, um die Quartale des Jahres visuell zu trennen. Die Icons sind einfach, aber informativ und entsprechen ihren jeweiligen saisonalen Aktivitäten.


