

Your graphics add a nice touch to my presentations and I recently used them for one of my all-hands meetings. Your toolbox adds professionalism to my slides. Instead of using standard clipart.
Claude Jones, Director of Engineer, @Walmartlabs, USA

Your graphics add a nice touch to my presentations and I recently used them for one of my all-hands meetings. Your toolbox adds professionalism to my slides. Instead of using standard clipart.
Claude Jones, Director of Engineer, @Walmartlabs, USA
I needed a fresh look at some of my slides. I've tried to find a way to create a paintbrush effect, to underline, accentuate, add some color and the handwritten markers were just the things. Very easy to use, easy to size, change the color. It was an affordable, perfect solution and I'm happy to recommend it.
Anonymous, US
The crisp, clean look of the graphics, and the fact that it allowed me to easily edit and change the colors to match the template was my main reason for purchasing them.
Brandie Jenkins, E-learning Developer, USA
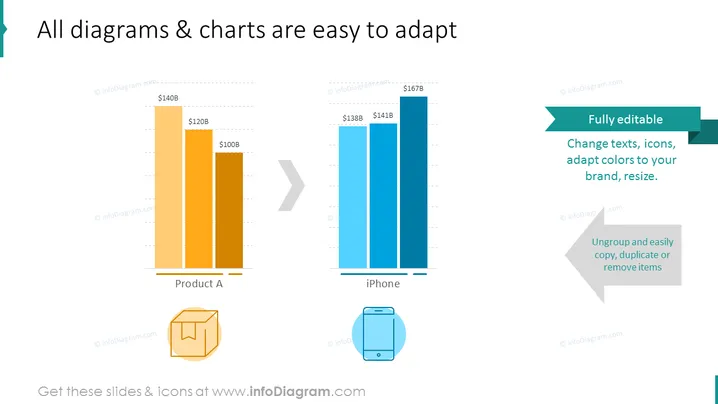
Die Folie zeigt wahrscheinlich die Anpassungsmerkmale von Diagrammen und Grafiken, die in Präsentationen verwendet werden. Sie vergleicht die Verkaufswerte von "Produkt A" und "iPhone", wobei erstere Skalenwerte bei 100 Milliarden $, 120 Milliarden $ und 140 Milliarden $ hat und letztere bei 138 Milliarden $, 141 Milliarden $ und 167 Milliarden $. "Produkt A" hat zwei dargestellte Werte, während das iPhone drei Balken zeigt, die einen schrittweisen Anstieg der Verkäufe darstellen. An der Seite der Folie wird erwähnt, dass die Diagramme "Vollständig bearbeitbar" sind, was darauf hindeutet, dass Text, Symbole, Farben und Größe geändert werden können. Es steht auch "Gruppieren und Elemente einfach kopieren, duplizieren oder entfernen", was auf weitere Anpassungsoptionen hinweist. Jede Funktion ermöglicht es den Nutzern, die Präsentation auf spezifische Branding- oder Designbedürfnisse zuzuschneiden.



