

Your graphics add a nice touch to my presentations and I recently used them for one of my all-hands meetings. Your toolbox adds professionalism to my slides. Instead of using standard clipart.
Claude Jones, Director of Engineer, @Walmartlabs, USA

Your graphics add a nice touch to my presentations and I recently used them for one of my all-hands meetings. Your toolbox adds professionalism to my slides. Instead of using standard clipart.
Claude Jones, Director of Engineer, @Walmartlabs, USA
I needed a fresh look at some of my slides. I've tried to find a way to create a paintbrush effect, to underline, accentuate, add some color and the handwritten markers were just the things. Very easy to use, easy to size, change the color. It was an affordable, perfect solution and I'm happy to recommend it.
Anonymous, US
The crisp, clean look of the graphics, and the fact that it allowed me to easily edit and change the colors to match the template was my main reason for purchasing them.
Brandie Jenkins, E-learning Developer, USA
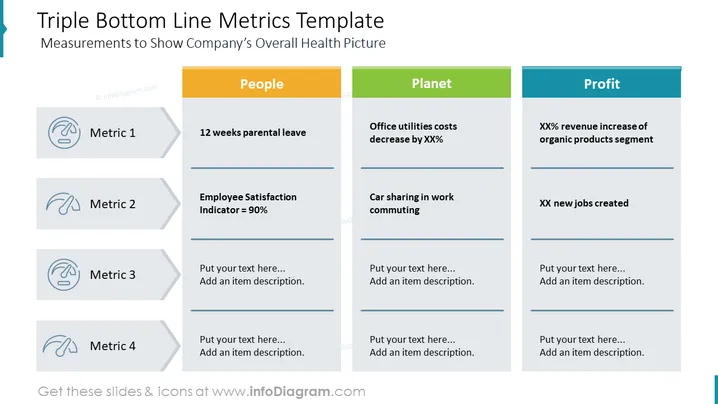
Diese PowerPoint-Tabelle bietet eine visuelle Darstellung des Konzepts der Dreifachen Ergebnislinie (TBL), einem Rahmen zur Messung der Unternehmensleistung in Bezug auf soziale, ökologische und finanzielle Faktoren. Die Folie veranschaulicht effektiv die Wechselseitigkeit dieser drei Dimensionen und hebt wichtige Kennzahlen für jeden Bereich hervor. Diese Infografik-ähnliche Folie kann in verschiedenen Unternehmenspräsentationen verwendet werden, insbesondere in solchen, die sich auf Nachhaltigkeit, unternehmerische soziale Verantwortung und die allgemeine Unternehmensleistung konzentrieren. Sie dient als wertvolles Werkzeug zur Kommunikation des Engagements eines Unternehmens für nachhaltige Praktiken und seiner Bemühungen, Gewinn mit sozialer und ökologischer Verantwortung in Einklang zu bringen.



