Your graphics add a nice touch to my presentations and I recently used them for one of my all-hands meetings. Your toolbox adds professionalism to my slides. Instead of using standard clipart.
Claude Jones, Director of Engineer, @Walmartlabs, USA
Your graphics add a nice touch to my presentations and I recently used them for one of my all-hands meetings. Your toolbox adds professionalism to my slides. Instead of using standard clipart.
Claude Jones, Director of Engineer, @Walmartlabs, USA
I needed a fresh look at some of my slides. I've tried to find a way to create a paintbrush effect, to underline, accentuate, add some color and the handwritten markers were just the things. Very easy to use, easy to size, change the color. It was an affordable, perfect solution and I'm happy to recommend it.
Anonymous, US
The crisp, clean look of the graphics, and the fact that it allowed me to easily edit and change the colors to match the template was my main reason for purchasing them.
Brandie Jenkins, E-learning Developer, USA
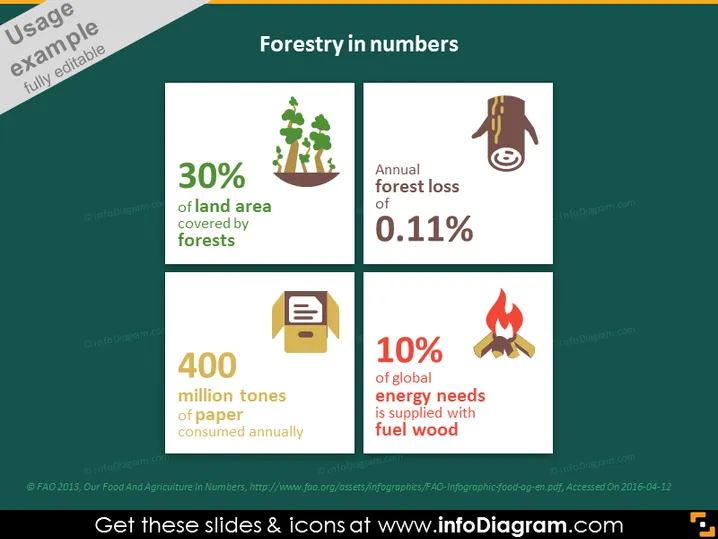
Die Folie mit dem Titel "Forstwirtschaft in Zahlen" präsentiert Statistiken zu Wäldern und ihrer Rolle in der Ökologie und Wirtschaft. Vier zentrale Kennzahlen werden hervorgehoben: "30%" repräsentiert den Anteil der Landfläche, der von Wäldern bedeckt ist, und symbolisiert das Ausmaß der Aufforstung. "Jährlicher Waldverlust von 0,11%" weist auf die Rate hin, mit der Wälder jedes Jahr abnehmen, ein kritisches Umweltproblem. "400 Millionen Tonnen Papier werden jährlich konsumiert" verweist auf die erhebliche Nachfrage nach Papier, das typischerweise aus Bäumen hergestellt wird. Schließlich hebt "10% des globalen Energiebedarfs wird mit Brennholz gedeckt" die Abhängigkeit von Holz als Energiequelle hervor, was in Diskussionen über nachhaltige Energiepraktiken relevant ist.
Die Folie hat ein sauberes und strukturiertes Design mit einer klaren Unterscheidung zwischen den verschiedenen Inhaltsbereichen durch die Verwendung von Farbblöcken und Symbolen. Die visuellen Elemente sind einfach, aber effektiv, um die Statistiken in einem leicht verständlichen Format zu vermitteln.


