

Your graphics add a nice touch to my presentations and I recently used them for one of my all-hands meetings. Your toolbox adds professionalism to my slides. Instead of using standard clipart.
Claude Jones, Director of Engineer, @Walmartlabs, USA

Your graphics add a nice touch to my presentations and I recently used them for one of my all-hands meetings. Your toolbox adds professionalism to my slides. Instead of using standard clipart.
Claude Jones, Director of Engineer, @Walmartlabs, USA
I needed a fresh look at some of my slides. I've tried to find a way to create a paintbrush effect, to underline, accentuate, add some color and the handwritten markers were just the things. Very easy to use, easy to size, change the color. It was an affordable, perfect solution and I'm happy to recommend it.
Anonymous, US
The crisp, clean look of the graphics, and the fact that it allowed me to easily edit and change the colors to match the template was my main reason for purchasing them.
Brandie Jenkins, E-learning Developer, USA
(Marktanteil + Umsatz des letzten Jahres)
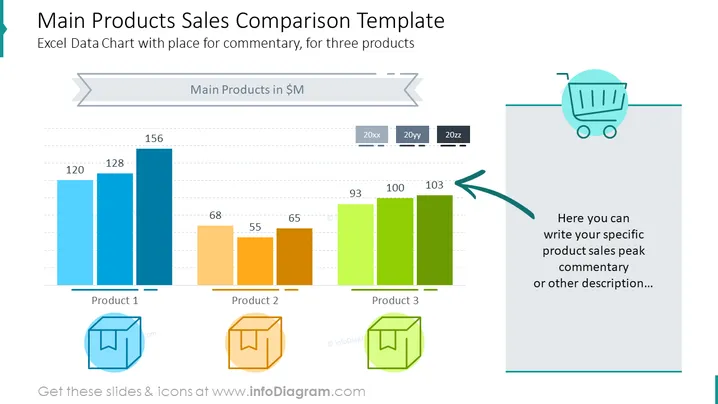
Bunter PowerPoint-Vorlage, die die Verkaufszahlen der Hauptprodukte vergleicht. Bearbeitbare, Excel-gesteuerte Balkendiagramme zeigen Finanzdaten, die im Beschreibungsbereich auf der Seite detailliert kommentiert werden können. Jedes Element dieses Diagramms kann dank des skizzierten ovalen, bearbeitbaren Markers hervorgehoben werden.
Dieses Beispiel: Verkaufsvolumen-Grafik für Apple-Geräte ist Teil unserer PowerPoint-Vorlage für Produktvertriebsberichte.



