

Your graphics add a nice touch to my presentations and I recently used them for one of my all-hands meetings. Your toolbox adds professionalism to my slides. Instead of using standard clipart.
Claude Jones, Director of Engineer, @Walmartlabs, USA

Your graphics add a nice touch to my presentations and I recently used them for one of my all-hands meetings. Your toolbox adds professionalism to my slides. Instead of using standard clipart.
Claude Jones, Director of Engineer, @Walmartlabs, USA
I needed a fresh look at some of my slides. I've tried to find a way to create a paintbrush effect, to underline, accentuate, add some color and the handwritten markers were just the things. Very easy to use, easy to size, change the color. It was an affordable, perfect solution and I'm happy to recommend it.
Anonymous, US
The crisp, clean look of the graphics, and the fact that it allowed me to easily edit and change the colors to match the template was my main reason for purchasing them.
Brandie Jenkins, E-learning Developer, USA
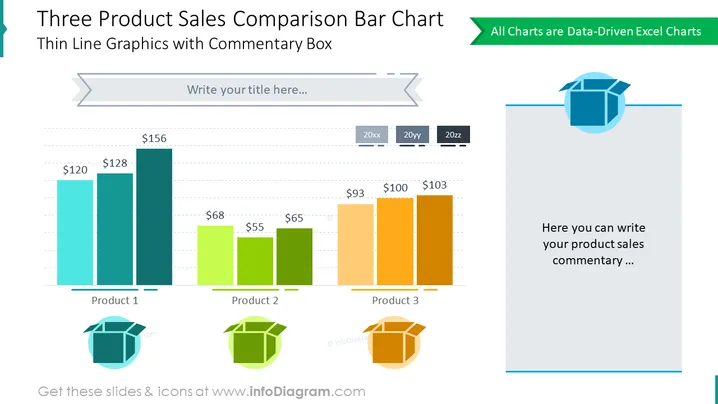
Die Folie mit dem Titel "Balkendiagramm zum Vergleich von Verkäufen dreier Produkte" veranschaulicht einen grafischen Vergleich der Verkaufszahlen dreier Produkte zu verschiedenen Zeitpunkten, die als '20x, '20y und '20z bezeichnet sind. Das erste Produkt zeigt steigende Verkaufszahlen von 120 $ auf 156 $, was auf ein Wachstum oder eine verbesserte Marktleistung hindeutet. Das zweite Produkt weist Schwankungen auf, da die Verkaufszahlen zunächst von 68 $ auf 55 $ sinken und dann auf 65 $ steigen, was auf Variabilität in der Verkaufsleistung oder der Marktresonanz hinweist. Das dritte Produkt hat einen konstanten Anstieg der Verkaufszahlen von 93 $ auf 103 $, was auf stetigen Fortschritt oder positive Marktreaktionen hinweist. Ein Kommentarfeld deutet darauf hin, dass die Folie für Eingaben zu den individuellen Verkaufsleistungsnarrativen der Produkte konzipiert ist.
Das Gesamtbild der Folie ist modern und sauber, mit einer effizienten Raumnutzung, die sich auf den Vergleich der Daten dreier verschiedener Produkte konzentriert. Die Designelemente und die Farbcodierung ermöglichen es, die Informationen auf einen Blick leicht zu erfassen.



