
Your graphics add a nice touch to my presentations and I recently used them for one of my all-hands meetings. Your toolbox adds professionalism to my slides. Instead of using standard clipart.
Claude Jones, Director of Engineer, @Walmartlabs, USA

Your graphics add a nice touch to my presentations and I recently used them for one of my all-hands meetings. Your toolbox adds professionalism to my slides. Instead of using standard clipart.
Claude Jones, Director of Engineer, @Walmartlabs, USA

I needed a fresh look at some of my slides. I've tried to find a way to create a paintbrush effect, to underline, accentuate, add some color and the handwritten markers were just the things. Very easy to use, easy to size, change the color. It was an affordable, perfect solution and I'm happy to recommend it.
Anonymous, US
The crisp, clean look of the graphics, and the fact that it allowed me to easily edit and change the colors to match the template was my main reason for purchasing them.
Brandie Jenkins, E-learning Developer, USA
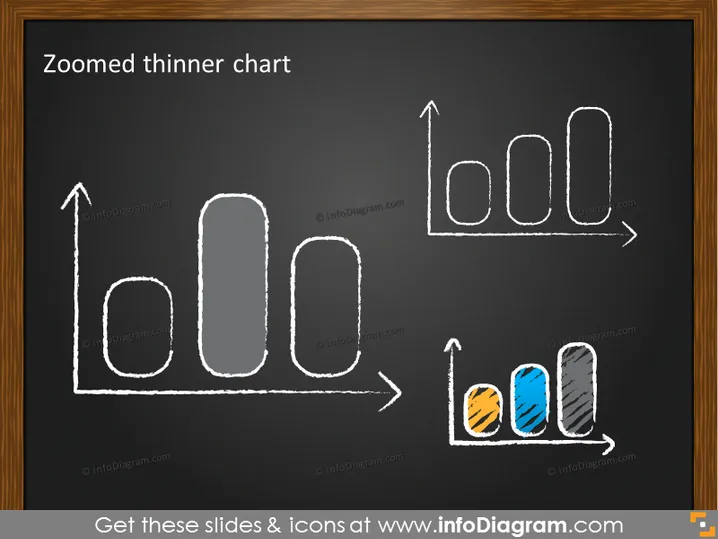
Die Folie präsentiert ein Konzept namens "Vergrößern Dünner Chart", das anscheinend eine Methode der Datenrepräsentation beschreibt. Sie zeigt zwei Balkendiagramme; das erste ist eine einfache Umrisszeichnung mit drei ungefärbten Balken, die von links nach rechts in der Höhe zunehmen. Das zweite Diagramm scheint ein vergrößerter Ausschnitt eines größeren Diagramms zu sein, mit drei Balken, die orange, blau und grau gefärbt sind, was auf einen Fokus auf einen bestimmten Teil der Daten hinweist.
Die Folie hat ein kreatives und lehrreiches Gefühl, das an eine auf einer Tafel erteilte Lektion erinnert, unterstützt durch den handgeschriebenen Kreidestil von Texten und Illustrationen.


