

Your graphics add a nice touch to my presentations and I recently used them for one of my all-hands meetings. Your toolbox adds professionalism to my slides. Instead of using standard clipart.
Claude Jones, Director of Engineer, @Walmartlabs, USA

Your graphics add a nice touch to my presentations and I recently used them for one of my all-hands meetings. Your toolbox adds professionalism to my slides. Instead of using standard clipart.
Claude Jones, Director of Engineer, @Walmartlabs, USA
I needed a fresh look at some of my slides. I've tried to find a way to create a paintbrush effect, to underline, accentuate, add some color and the handwritten markers were just the things. Very easy to use, easy to size, change the color. It was an affordable, perfect solution and I'm happy to recommend it.
Anonymous, US
The crisp, clean look of the graphics, and the fact that it allowed me to easily edit and change the colors to match the template was my main reason for purchasing them.
Brandie Jenkins, E-learning Developer, USA
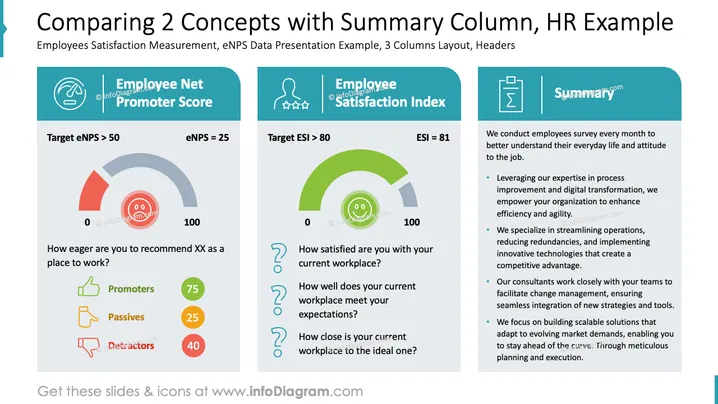
Die Folie präsentiert einen Vergleich von zwei Schlüsselkonzepten: Employee Net Promoter Score (eNPS) und Employee Satisfaction Index (ESI). Der eNPS misst, wie wahrscheinlich es ist, dass Mitarbeiter ihren Arbeitsplatz empfehlen, mit einem Zielwert von über 50; der aktuelle Wert liegt bei 25. Die Zufriedenheitsstufen sind in Promotoren, Passive und Abneiger unterteilt. Der ESI bewertet die Mitarbeiterzufriedenheit mit ihrem Arbeitsplatz, mit dem Zielwert über 80, und der aktuelle Wert liegt bei 81. Eine Zusammenfassung auf der rechten Seite skizziert Strategien zur Verbesserung der Effizienz am Arbeitsplatz und zur Transformation durch Fachkenntnisse in der Prozessoptimierung, optimierten Abläufen und innovativen Lösungen.
Insgesamt ist die Folie visuell strukturiert mit klaren Abschnitten und einem ausgewogenen Einsatz von Icons und Farben, um komplexe Konzepte effektiv zu veranschaulichen. Das Layout hilft, Vergleiche und Zusammenfassungen auf einen Blick verständlich zu machen.



