Your graphics add a nice touch to my presentations and I recently used them for one of my all-hands meetings. Your toolbox adds professionalism to my slides. Instead of using standard clipart.
Claude Jones, Director of Engineer, @Walmartlabs, USA
Your graphics add a nice touch to my presentations and I recently used them for one of my all-hands meetings. Your toolbox adds professionalism to my slides. Instead of using standard clipart.
Claude Jones, Director of Engineer, @Walmartlabs, USA
I needed a fresh look at some of my slides. I've tried to find a way to create a paintbrush effect, to underline, accentuate, add some color and the handwritten markers were just the things. Very easy to use, easy to size, change the color. It was an affordable, perfect solution and I'm happy to recommend it.
Anonymous, US
The crisp, clean look of the graphics, and the fact that it allowed me to easily edit and change the colors to match the template was my main reason for purchasing them.
Brandie Jenkins, E-learning Developer, USA
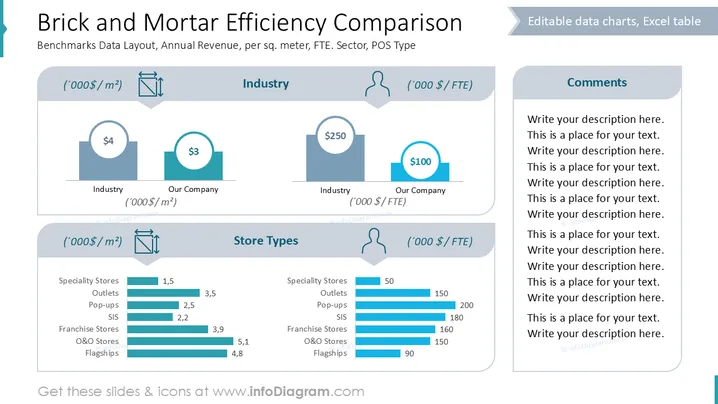
Die Folie vergleicht die Effizienz von stationären Einzelhandelsstandorten, indem sie die Leistung der Branche und des Unternehmens, den jährlichen Umsatz pro Quadratmeter und verschiedene Geschäftsarten evaluiert. Der Abschnitt "Branche" bewertet allgemeine Branchenkennzahlen im Vergleich zu den Unternehmenszahlen und bietet Einblicke in die Umsatzeffizienz. "Geschäftstypen" hebt hervor, wie verschiedene Geschäftsmodelle wie Fachgeschäfte oder Flagship-Stores hinsichtlich der finanziellen Rendite pro Fläche und der Kennzahlen für Vollzeitäquivalente (FTE) abschneiden.
Das gesamte Design ist ordentlich und verwendet Farbkontraste, um zwischen den Abschnitten zu unterscheiden, was die Lesbarkeit und visuelle Anziehungskraft erhöht. Klare grafische Elemente helfen, komplexe Daten zu verstehen.


