Your graphics add a nice touch to my presentations and I recently used them for one of my all-hands meetings. Your toolbox adds professionalism to my slides. Instead of using standard clipart.
Claude Jones, Director of Engineer, @Walmartlabs, USA
Your graphics add a nice touch to my presentations and I recently used them for one of my all-hands meetings. Your toolbox adds professionalism to my slides. Instead of using standard clipart.
Claude Jones, Director of Engineer, @Walmartlabs, USA
I needed a fresh look at some of my slides. I've tried to find a way to create a paintbrush effect, to underline, accentuate, add some color and the handwritten markers were just the things. Very easy to use, easy to size, change the color. It was an affordable, perfect solution and I'm happy to recommend it.
Anonymous, US
The crisp, clean look of the graphics, and the fact that it allowed me to easily edit and change the colors to match the template was my main reason for purchasing them.
Brandie Jenkins, E-learning Developer, USA
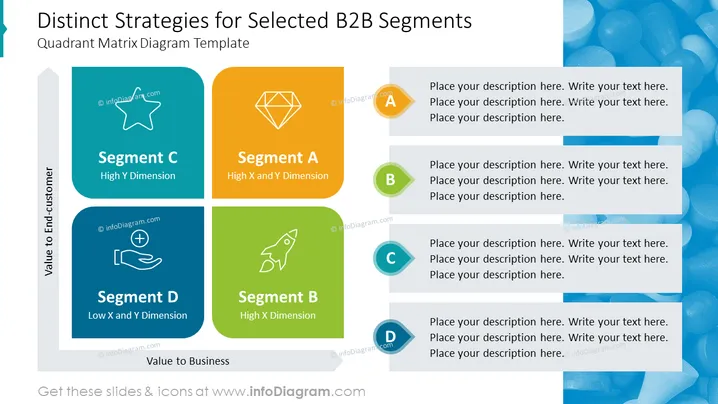
Diese PowerPoint-Folie trägt den Titel "Unterschiedliche Strategien für ausgewählte B2B-Segmente" und präsentiert eine Quadrantenmatrix-Diagrammvorlage zur Kategorisierung verschiedener Geschäftsegmente basierend auf zwei Dimensionen: 'Wert für den Kunden' und 'Wert für das Unternehmen'. Jeder Quadrant repräsentiert ein Segment, das mit A, B, C oder D gekennzeichnet ist, wobei die Segmente A und B eine hohe 'X-Dimension' (Wert für das Unternehmen) haben, das Segment A auch eine hohe 'Y-Dimension' (Wert für den Kunden) aufweist, das Segment C allein eine hohe 'Y-Dimension' hat und das Segment D niedrige X- und Y-Dimensionen zeigt. Diese Segmente können verwendet werden, um unterschiedliche B2B-Kundengruppen basierend auf ihren Wertversprechen zu positionieren und zu strategisieren.
Die Folie ist mit einem professionellen und sauberen Layout gestaltet, das kontrastreiche Farben und kräftige Grafiken verwendet, um die unterschiedlichen Segmente hervorzuheben. Der Einsatz von Symbolen und Farbcodierung macht die Informationen leicht verständlich und visuell ansprechend.


