
Your graphics add a nice touch to my presentations and I recently used them for one of my all-hands meetings. Your toolbox adds professionalism to my slides. Instead of using standard clipart.
Claude Jones, Director of Engineer, @Walmartlabs, USA
Your graphics add a nice touch to my presentations and I recently used them for one of my all-hands meetings. Your toolbox adds professionalism to my slides. Instead of using standard clipart.
Claude Jones, Director of Engineer, @Walmartlabs, USA
I needed a fresh look at some of my slides. I've tried to find a way to create a paintbrush effect, to underline, accentuate, add some color and the handwritten markers were just the things. Very easy to use, easy to size, change the color. It was an affordable, perfect solution and I'm happy to recommend it.
Anonymous, US
The crisp, clean look of the graphics, and the fact that it allowed me to easily edit and change the colors to match the template was my main reason for purchasing them.
Brandie Jenkins, E-learning Developer, USA
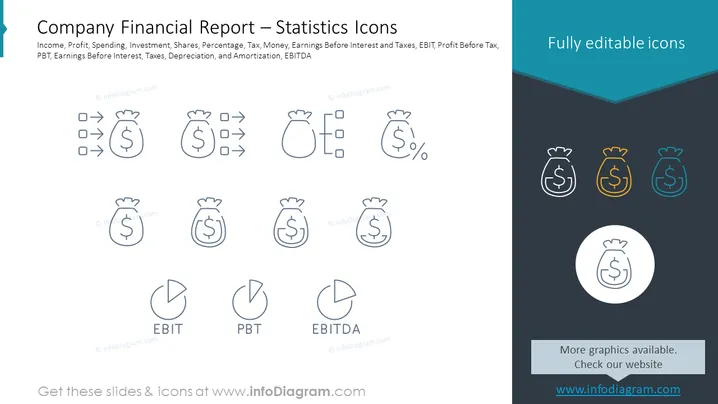
Diese Folie mit dem Titel "Unternehmensfinanzbericht — Statistiksymbole" ist eine Sammlung von Symbolen, die verschiedene finanzielle Kennzahlen darstellen. Sie umfasst Symbole für Einkommen, Gewinn, Ausgaben, Investitionen, Aktien, Prozentsätze, Steuern, Geld, Gewinn vor Zinsen und Steuern (EBIT), Gewinn vor Steuern (PBT), Gewinn vor Zinsen, Steuern, Abschreibungen und Amortisation (EBITDA). Jedes Element symbolisiert ein zentrales finanzielles Konzept: Einkommen für Umsatzgenerierung, Gewinn zeigt den Nettogewinn an, Ausgaben für Kosten, Investitionen für Anlageverteilung, Aktien für Eigenkapital, Prozentsatz für Verhältnisse oder Wachstumskennzahlen, Steuern zeigen fiskalische Verpflichtungen an, und EBIT/EBITDA für betriebliche Leistung.
Die Folie präsentiert ein sauberes, professionelles Erscheinungsbild mit einem ausgewogenen Einsatz von Leerraum und einem simplen Symbolstil. Die Farbakzente bieten einen visuellen Kontrast, der die verschiedenen finanziellen Elemente hervorhebt.




