

Your graphics add a nice touch to my presentations and I recently used them for one of my all-hands meetings. Your toolbox adds professionalism to my slides. Instead of using standard clipart.
Claude Jones, Director of Engineer, @Walmartlabs, USA

Your graphics add a nice touch to my presentations and I recently used them for one of my all-hands meetings. Your toolbox adds professionalism to my slides. Instead of using standard clipart.
Claude Jones, Director of Engineer, @Walmartlabs, USA
I needed a fresh look at some of my slides. I've tried to find a way to create a paintbrush effect, to underline, accentuate, add some color and the handwritten markers were just the things. Very easy to use, easy to size, change the color. It was an affordable, perfect solution and I'm happy to recommend it.
Anonymous, US
The crisp, clean look of the graphics, and the fact that it allowed me to easily edit and change the colors to match the template was my main reason for purchasing them.
Brandie Jenkins, E-learning Developer, USA
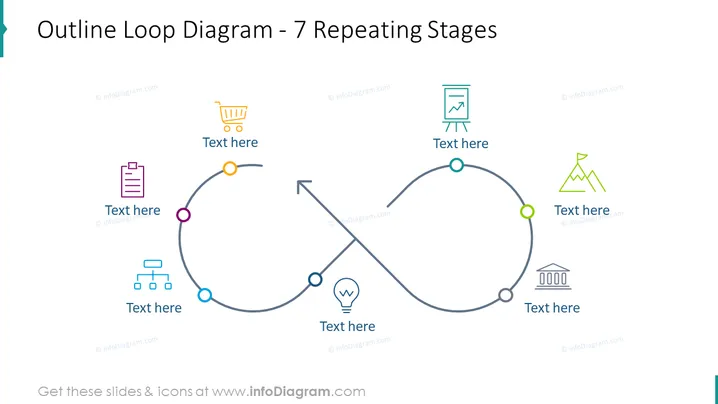
Die PowerPoint-Folie präsentiert ein "Umriss Loop-Diagramm - 7 Wiederkehrende Phasen", das einen zyklischen Prozess mit sieben miteinander verbundenen Phasen zeigt, die durch einen geschlungenen Linienpfad dargestellt werden. Jede Phase ist mit einem deutlich gefärbten Kreis und einem zugehörigen Symbol gekennzeichnet, das verschiedene Elemente darstellt. Der Loop zeigt einen kontinuierlichen Prozessfluss, bei dem jede Phase zu einer anderen in einem sich wiederholenden Zyklus führt. Konkrete Beschreibungen können für jede Phase hinzugefügt werden, was darauf hindeutet, dass das Diagramm verwendet werden könnte, um Schritte in einem laufenden Projekt, einem Feedbackloop-System oder einem zirkulären Geschäftskonzept zu veranschaulichen.



