

Your graphics add a nice touch to my presentations and I recently used them for one of my all-hands meetings. Your toolbox adds professionalism to my slides. Instead of using standard clipart.
Claude Jones, Director of Engineer, @Walmartlabs, USA

Your graphics add a nice touch to my presentations and I recently used them for one of my all-hands meetings. Your toolbox adds professionalism to my slides. Instead of using standard clipart.
Claude Jones, Director of Engineer, @Walmartlabs, USA
I needed a fresh look at some of my slides. I've tried to find a way to create a paintbrush effect, to underline, accentuate, add some color and the handwritten markers were just the things. Very easy to use, easy to size, change the color. It was an affordable, perfect solution and I'm happy to recommend it.
Anonymous, US
The crisp, clean look of the graphics, and the fact that it allowed me to easily edit and change the colors to match the template was my main reason for purchasing them.
Brandie Jenkins, E-learning Developer, USA
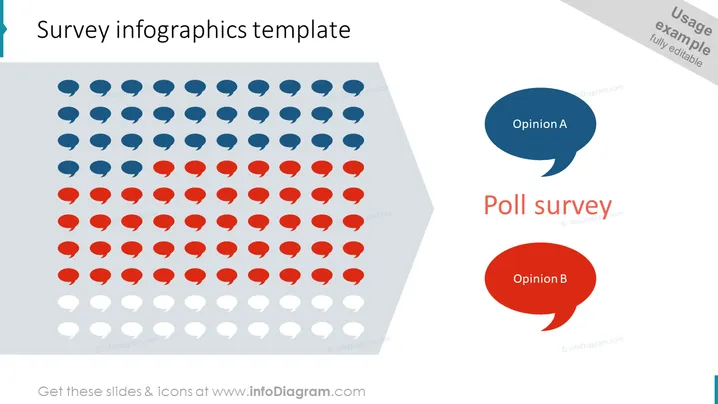
Die Folie veranschaulicht das Ergebnis einer Umfrage mit einer graphischen Darstellung verschiedener Meinungen. Ikonische rote, blaue und graue Sprechblasen zeigen die Verteilung der Antworten über drei Kategorien: Meinung A, Meinung B und eine dritte, nicht näher bezeichnete Kategorie. Meinung A wird durch blaue Sprechblasen symbolisiert, was auf einen bestimmten Standpunkt oder eine Wahl hinweist, während Meinung B durch rote Sprechblasen dargestellt wird, die eine alternative Perspektive oder Auswahl angeben. Die grauen Sprechblasen repräsentieren wahrscheinlich entweder Enthaltungen oder einen neutralen Standpunkt und füllen den Rest des Antwortspektrums aus.



