Your graphics add a nice touch to my presentations and I recently used them for one of my all-hands meetings. Your toolbox adds professionalism to my slides. Instead of using standard clipart.
Claude Jones, Director of Engineer, @Walmartlabs, USA
Your graphics add a nice touch to my presentations and I recently used them for one of my all-hands meetings. Your toolbox adds professionalism to my slides. Instead of using standard clipart.
Claude Jones, Director of Engineer, @Walmartlabs, USA
I needed a fresh look at some of my slides. I've tried to find a way to create a paintbrush effect, to underline, accentuate, add some color and the handwritten markers were just the things. Very easy to use, easy to size, change the color. It was an affordable, perfect solution and I'm happy to recommend it.
Anonymous, US
The crisp, clean look of the graphics, and the fact that it allowed me to easily edit and change the colors to match the template was my main reason for purchasing them.
Brandie Jenkins, E-learning Developer, USA
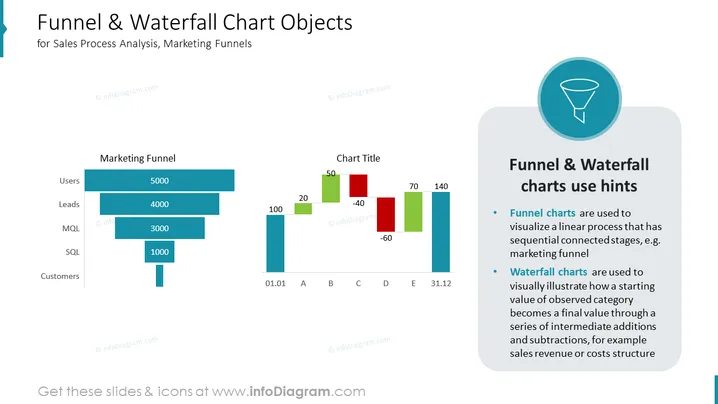
Diese PowerPoint-Folie trägt den Titel "Trichter- & Wasserfall-Diagramm-Objekte" und ist für die Analyse von Verkaufsprozessen und Marketingtrichtern vorgesehen. Sie zeigt auf der linken Seite einen "Marketingtrichter", der einen Rückgang der Menge von Nutzern zu Kunden darstellt, mit Zahlen wie 5000 für Nutzer und 1000 für SQL. Auf der rechten Seite befindet sich ein "Wasserfall-Diagramm" mit positiven und negativen Werten, wie 20 für 'B' und -40 für 'C', sowie einem Abschnitt "Hinweise zur Verwendung von Trichter- & Wasserfall-Diagrammen", der die Anwendung von Trichterdiagrammen zur Darstellung linearer Prozesse und Wasserfalldiagrammen zur Veranschaulichung von Änderungen der Ausgangswerte durch Hinzufügungen und Subtraktionen erklärt.


