

Your graphics add a nice touch to my presentations and I recently used them for one of my all-hands meetings. Your toolbox adds professionalism to my slides. Instead of using standard clipart.
Claude Jones, Director of Engineer, @Walmartlabs, USA

Your graphics add a nice touch to my presentations and I recently used them for one of my all-hands meetings. Your toolbox adds professionalism to my slides. Instead of using standard clipart.
Claude Jones, Director of Engineer, @Walmartlabs, USA
I needed a fresh look at some of my slides. I've tried to find a way to create a paintbrush effect, to underline, accentuate, add some color and the handwritten markers were just the things. Very easy to use, easy to size, change the color. It was an affordable, perfect solution and I'm happy to recommend it.
Anonymous, US
The crisp, clean look of the graphics, and the fact that it allowed me to easily edit and change the colors to match the template was my main reason for purchasing them.
Brandie Jenkins, E-learning Developer, USA
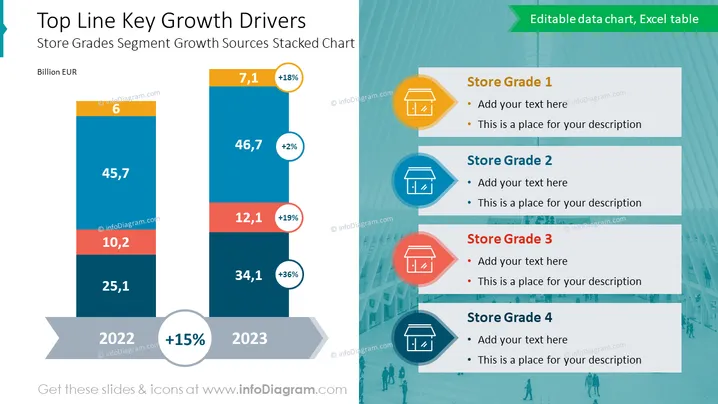
Die Folie mit dem Titel "Wichtige Wachstumsfaktoren der obersten Linie" visualisiert die Wachstumsquellen der Store-Bewertungen mithilfe eines gestapelten Diagramms. Sie zeigt die Daten für die Jahre 2022 und 2023 in Milliarden EUR und weist auf ein Wachstum von +15% hin. Vier Segmente werden mit unterschiedlichen Farben dargestellt, und jedes hat einen prozentualen Anstieg: das erste Segment wuchs um +18%, das zweite um +2%, das dritte um +19% und das vierte um +36%. Auf der rechten Seite gibt es Platzhalter für Beschreibungen zu vier verschiedenen Store-Bewertungen, die jeweils mit einem farbigen Symbol versehen sind, das mit den Segmenten im gestapelten Diagramm übereinstimmt.
Das Gesamtbild der Folie ist sauber und professionell, mit starkem Einsatz von Farben zur Trennung der Informationen. Die Ausrichtung und Designelemente schaffen eine klare visuelle Hierarchie, die den Betrachter durch die Daten führt.



