

Your graphics add a nice touch to my presentations and I recently used them for one of my all-hands meetings. Your toolbox adds professionalism to my slides. Instead of using standard clipart.
Claude Jones, Director of Engineer, @Walmartlabs, USA

Your graphics add a nice touch to my presentations and I recently used them for one of my all-hands meetings. Your toolbox adds professionalism to my slides. Instead of using standard clipart.
Claude Jones, Director of Engineer, @Walmartlabs, USA
I needed a fresh look at some of my slides. I've tried to find a way to create a paintbrush effect, to underline, accentuate, add some color and the handwritten markers were just the things. Very easy to use, easy to size, change the color. It was an affordable, perfect solution and I'm happy to recommend it.
Anonymous, US
The crisp, clean look of the graphics, and the fact that it allowed me to easily edit and change the colors to match the template was my main reason for purchasing them.
Brandie Jenkins, E-learning Developer, USA
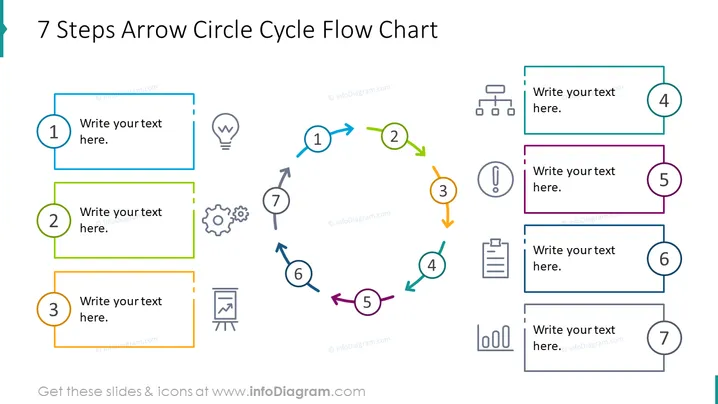
Diese PowerPoint-Folie präsentiert einen zyklischen Prozess mit einem "7 Schritte Pfeil Kreis Zyklus Flussdiagramm". Jeder der sieben Schritte wird durch ein kreisförmiges nummeriertes Element dargestellt, das mit einem Textfeld verbunden ist, in dem spezifische Informationen notiert werden können. Der farbige Rand jedes Feldes entspricht der Farbe des zugehörigen Kreises, was die visuelle Kohärenz unterstützt. Die Uhrzeigerfolge deutet auf einen wiederkehrenden Prozess oder eine Fortschrittsbewegung durch Aufgaben oder Phasen hin. Diese Art der Visualisierung ist effektiv, um iterative Arbeitsabläufe, Produktlebenszyklus oder kontinuierliche Verbesserungsmodelle zu erklären.
Das gesamte Erscheinungsbild ist sauber und professionell, mit einem klaren, bunten Schema, um jeden Schritt im Zyklus zu differenzieren. Die Textfelder bieten ausreichend Platz für Erklärungen, während einfache, aber eindrucksvolle Symbole als visuelle Hinweise dienen.



