Your graphics add a nice touch to my presentations and I recently used them for one of my all-hands meetings. Your toolbox adds professionalism to my slides. Instead of using standard clipart.
Claude Jones, Director of Engineer, @Walmartlabs, USA
Your graphics add a nice touch to my presentations and I recently used them for one of my all-hands meetings. Your toolbox adds professionalism to my slides. Instead of using standard clipart.
Claude Jones, Director of Engineer, @Walmartlabs, USA
I needed a fresh look at some of my slides. I've tried to find a way to create a paintbrush effect, to underline, accentuate, add some color and the handwritten markers were just the things. Very easy to use, easy to size, change the color. It was an affordable, perfect solution and I'm happy to recommend it.
Anonymous, US
The crisp, clean look of the graphics, and the fact that it allowed me to easily edit and change the colors to match the template was my main reason for purchasing them.
Brandie Jenkins, E-learning Developer, USA
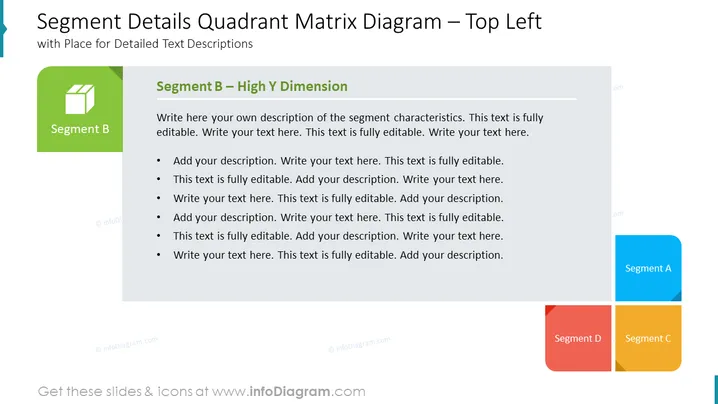
Die PowerPoint-Folie mit dem Titel "Segmentdetails Quadrant Matrix Diagram – Oben Links" scheint eine Vorlage zu sein, um detaillierte Beschreibungen von segmented Geschäftsdaten oder Analysen zu präsentieren. Insbesondere konzentriert sich diese Folie auf "Segment B – Hohe Y-Dimension" und bietet einen Platzhalter, damit die Benutzer ihre eigenen Beschreibungen hinzufügen können. Jeder Aufzählungspunkt betont, dass der Inhalt vollständig bearbeitbar ist und dazu dient, dass der Präsentator spezifische Details über das identifizierte Geschäftsssegment einfügt.
Die Folie hat ein sauberes und professionelles Design, das darauf fokussiert ist, Informationen klar zu präsentieren. Der Einsatz von Farbcodierung hilft, die Segmente zu unterscheiden, und der Platzhaltertext zeigt an, wo angepasste Inhalte hinzugefügt werden können.


