

Your graphics add a nice touch to my presentations and I recently used them for one of my all-hands meetings. Your toolbox adds professionalism to my slides. Instead of using standard clipart.
Claude Jones, Director of Engineer, @Walmartlabs, USA

Your graphics add a nice touch to my presentations and I recently used them for one of my all-hands meetings. Your toolbox adds professionalism to my slides. Instead of using standard clipart.
Claude Jones, Director of Engineer, @Walmartlabs, USA
I needed a fresh look at some of my slides. I've tried to find a way to create a paintbrush effect, to underline, accentuate, add some color and the handwritten markers were just the things. Very easy to use, easy to size, change the color. It was an affordable, perfect solution and I'm happy to recommend it.
Anonymous, US
The crisp, clean look of the graphics, and the fact that it allowed me to easily edit and change the colors to match the template was my main reason for purchasing them.
Brandie Jenkins, E-learning Developer, USA
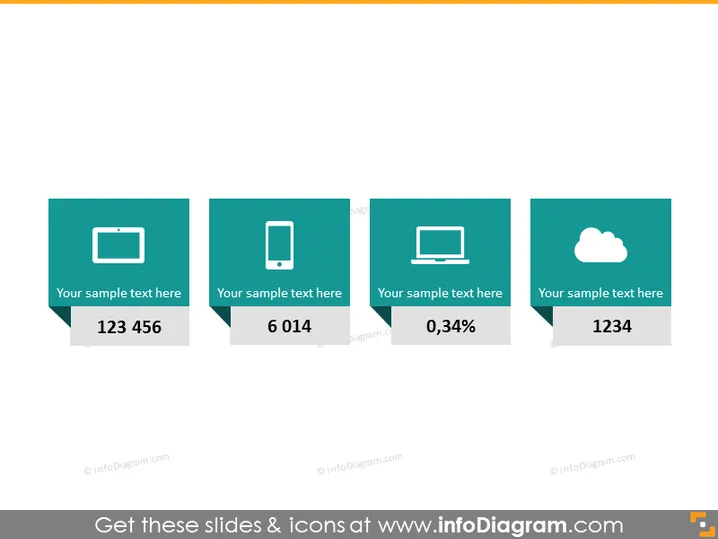
Die Folie scheint vier verschiedene wichtige Kennzahlen oder Datenpunkte zu zeigen, die jeweils mit unterschiedlichen technologischen Themen verbunden sind: Mobiltelefone, Tablets, Laptops und Cloud. Die Kennzahl für Mobiltelefone beträgt '6 014', was möglicherweise die Anzahl der mobilen Nutzer oder Geräte anzeigt. Das Tablet hat '123 456', was sich auf App-Downloads oder aktive Nutzer beziehen könnte. Die Daten des Laptops betragen '0,34%', was möglicherweise eine Konversionsrate oder Wachstumspercentage anzeigt. Schließlich ist die Cloud mit '1234' verbunden, was möglicherweise den genutzten Speicher oder verfügbare Cloud-Dienste darstellt.
Das Gesamtbild der Folie ist minimalistisch und modern, mit einem klaren Design, das die präsentierten Daten innerhalb jedes Blocks betont. Der Einsatz von Symbolen hilft, jede Kategorie visuell zu unterscheiden, wodurch die Informationen leicht verständlich werden.



