

Your graphics add a nice touch to my presentations and I recently used them for one of my all-hands meetings. Your toolbox adds professionalism to my slides. Instead of using standard clipart.
Claude Jones, Director of Engineer, @Walmartlabs, USA

Your graphics add a nice touch to my presentations and I recently used them for one of my all-hands meetings. Your toolbox adds professionalism to my slides. Instead of using standard clipart.
Claude Jones, Director of Engineer, @Walmartlabs, USA
I needed a fresh look at some of my slides. I've tried to find a way to create a paintbrush effect, to underline, accentuate, add some color and the handwritten markers were just the things. Very easy to use, easy to size, change the color. It was an affordable, perfect solution and I'm happy to recommend it.
Anonymous, US
The crisp, clean look of the graphics, and the fact that it allowed me to easily edit and change the colors to match the template was my main reason for purchasing them.
Brandie Jenkins, E-learning Developer, USA
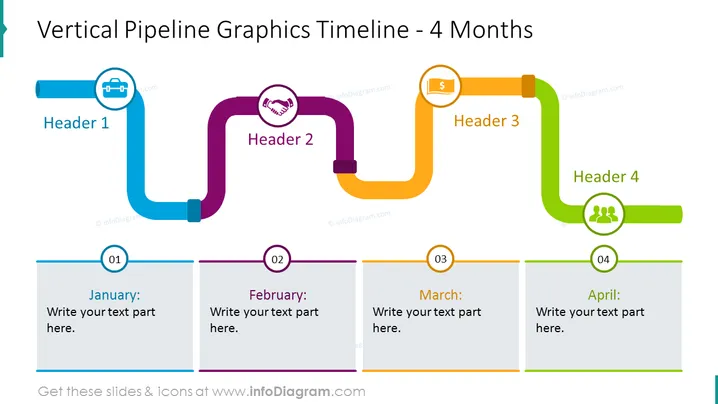
Diese PowerPoint-Folie mit dem Titel "Zeitachse für vertikale Pipeline-Grafiken - 4 Monate" legt einen Schritt-für-Schritt-Zeitplan oder Prozess über einen Zeitraum von vier Monaten dar, wobei jede Phase durch eine farbenfrohe Pipeline-Grafik verbunden ist. Jeder Schritt ist durch eine Überschrift (Überschriften 1 bis 4) und ein zugehöriges Symbol gekennzeichnet, das verschiedene Phasen oder Meilensteine in einem Prozess- oder Projektzeitplan anzeigt. Begleitend zu jeder Überschrift gibt es ein Textfeld (von 01 bis 04 bezeichnet) für detaillierte Beschreibungen, mit Beispieltexten, die vorschlagen, Inhalte zu den jeweiligen Monaten von Januar bis April zu schreiben.
Die Folie hat ein sauberes, modernes Design mit ausgewogenem Einsatz von Farbe und Raum, das visuelle Segmentation für Klarheit schafft. Die Metapher der Pipeline veranschaulicht effektiv einen Fluss oder eine Entwicklung durch Zeit oder Phasen.



