

Your graphics add a nice touch to my presentations and I recently used them for one of my all-hands meetings. Your toolbox adds professionalism to my slides. Instead of using standard clipart.
Claude Jones, Director of Engineer, @Walmartlabs, USA

Your graphics add a nice touch to my presentations and I recently used them for one of my all-hands meetings. Your toolbox adds professionalism to my slides. Instead of using standard clipart.
Claude Jones, Director of Engineer, @Walmartlabs, USA
I needed a fresh look at some of my slides. I've tried to find a way to create a paintbrush effect, to underline, accentuate, add some color and the handwritten markers were just the things. Very easy to use, easy to size, change the color. It was an affordable, perfect solution and I'm happy to recommend it.
Anonymous, US
The crisp, clean look of the graphics, and the fact that it allowed me to easily edit and change the colors to match the template was my main reason for purchasing them.
Brandie Jenkins, E-learning Developer, USA
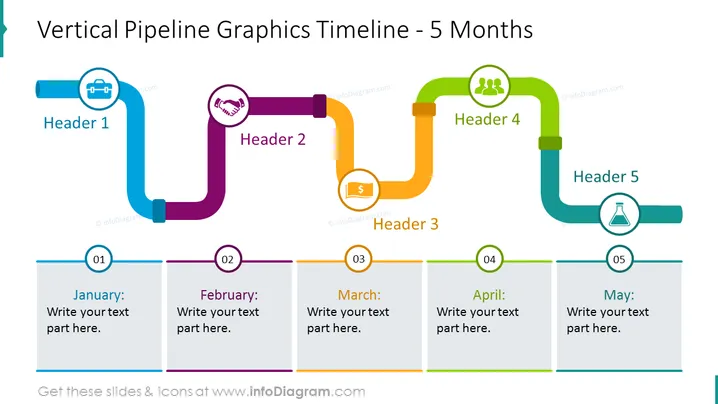
Die PowerPoint-Folie "Vertikale Pipeline-Grafiken Zeitachse - 5 Monate" skizziert einen 5-stufigen Prozess, der eine Zeitachse von Januar bis Mai symbolisiert. Jeder Schritt ist mit einer Überschrift und einem Symbol bezeichnet, das einer anderen Phase oder einem Thema entspricht, wie z.B. Finanzen oder Teamarbeit. Die Phasen sind mit vertikalen und horizontalen Pipeline-Segmenten verbunden, was auf einen Fortschritt oder Workflow hinweist. Die Zeitachse scheint ein Werkzeug zu sein, um wichtige Aufgaben, Meilensteine oder Veranstaltungen in einem monatlichen Format zu planen.
Das Gesamtbild der Folie ist lebhaft und gut organisiert und nutzt eine Mischung aus farbcodierten Grafiken, um einen sequenziellen Prozess zu vermitteln. Dieser visuelle Ansatz erleichtert das Nachverfolgen des Flusses von Aktivitäten oder Meilensteinen über den Zeitraum von 5 Monaten.



