

Your graphics add a nice touch to my presentations and I recently used them for one of my all-hands meetings. Your toolbox adds professionalism to my slides. Instead of using standard clipart.
Claude Jones, Director of Engineer, @Walmartlabs, USA

Your graphics add a nice touch to my presentations and I recently used them for one of my all-hands meetings. Your toolbox adds professionalism to my slides. Instead of using standard clipart.
Claude Jones, Director of Engineer, @Walmartlabs, USA
I needed a fresh look at some of my slides. I've tried to find a way to create a paintbrush effect, to underline, accentuate, add some color and the handwritten markers were just the things. Very easy to use, easy to size, change the color. It was an affordable, perfect solution and I'm happy to recommend it.
Anonymous, US
The crisp, clean look of the graphics, and the fact that it allowed me to easily edit and change the colors to match the template was my main reason for purchasing them.
Brandie Jenkins, E-learning Developer, USA
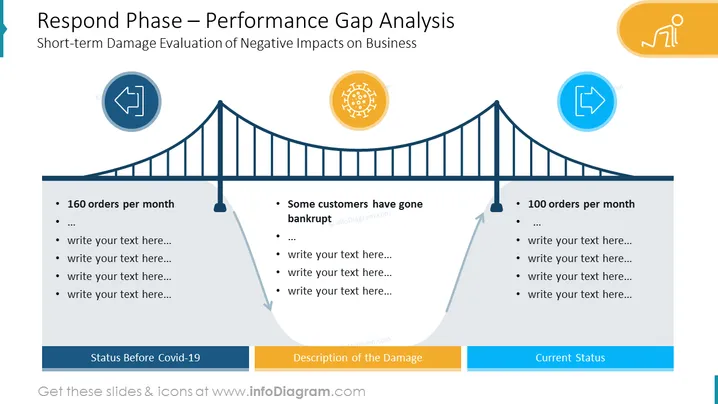
Die Folie trägt den Titel "Reaktionsphase – Analyse der Leistungsdifferenz" mit dem Untertitel "Kurzfristige Schadensbewertung negativer Auswirkungen auf das Unternehmen." Sie präsentiert eine visuelle Metapher einer Brücke, die eine Leistungsdifferenz anzeigt, mit drei Phasen: "Status vor Covid-19," "Beschreibung des Schadens" und "Aktueller Status." Die Brücke zeigt einen Abwärtstrend, während sie von links zur Mitte verläuft, und einen Aufwärtstrend zur rechten Seite, was auf eine Erholung hindeutet. In der ersten Phase werden "160 Aufträge pro Monat" aufgeführt, während in der mittleren Phase vermerkt ist: "Einige Kunden sind bankrott gegangen," und in der letzten Phase zeigt es "100 Aufträge pro Monat." Jede Phase hat zusätzliche Aufzählungspunkte für anpassbaren Text.



