Your graphics add a nice touch to my presentations and I recently used them for one of my all-hands meetings. Your toolbox adds professionalism to my slides. Instead of using standard clipart.
Claude Jones, Director of Engineer, @Walmartlabs, USA
Your graphics add a nice touch to my presentations and I recently used them for one of my all-hands meetings. Your toolbox adds professionalism to my slides. Instead of using standard clipart.
Claude Jones, Director of Engineer, @Walmartlabs, USA
I needed a fresh look at some of my slides. I've tried to find a way to create a paintbrush effect, to underline, accentuate, add some color and the handwritten markers were just the things. Very easy to use, easy to size, change the color. It was an affordable, perfect solution and I'm happy to recommend it.
Anonymous, US
The crisp, clean look of the graphics, and the fact that it allowed me to easily edit and change the colors to match the template was my main reason for purchasing them.
Brandie Jenkins, E-learning Developer, USA
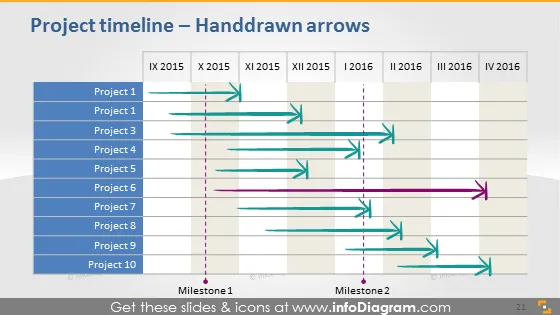
Die Folie ist eine visuelle Darstellung einer Projektzeitachse mit einer Liste von 10 Projekten, wobei jedes Projekt mit handgezeichneten Pfeilen versehen ist, die deren Dauer und Fortschritt anzeigen. Es gibt zwei Meilensteine, Meilenstein1 und Meilenstein2, die als Fahnen am unteren Rand dargestellt sind. Die Zeitachse erstreckt sich vom vierten Quartal 2015 bis zum ersten Quartal 2016, wobei jedes Quartal entsprechend beschriftet ist. Die Pfeile beginnen und enden an verschiedenen Punkten, was unterschiedliche Startzeiten und Dauern für die Projekte nahelegt.
Die Folie ist sauber und hat ein professionelles Aussehen, mit einem klaren Schwerpunkt auf der Zeitachse durch die Verwendung von bunten Pfeilen. Die Zeitlinien und Meilensteine verleihen ihr ein funktionales und zugleich visuell ansprechendes Layout.


