Your graphics add a nice touch to my presentations and I recently used them for one of my all-hands meetings. Your toolbox adds professionalism to my slides. Instead of using standard clipart.
Claude Jones, Director of Engineer, @Walmartlabs, USA
Your graphics add a nice touch to my presentations and I recently used them for one of my all-hands meetings. Your toolbox adds professionalism to my slides. Instead of using standard clipart.
Claude Jones, Director of Engineer, @Walmartlabs, USA
I needed a fresh look at some of my slides. I've tried to find a way to create a paintbrush effect, to underline, accentuate, add some color and the handwritten markers were just the things. Very easy to use, easy to size, change the color. It was an affordable, perfect solution and I'm happy to recommend it.
Anonymous, US
The crisp, clean look of the graphics, and the fact that it allowed me to easily edit and change the colors to match the template was my main reason for purchasing them.
Brandie Jenkins, E-learning Developer, USA
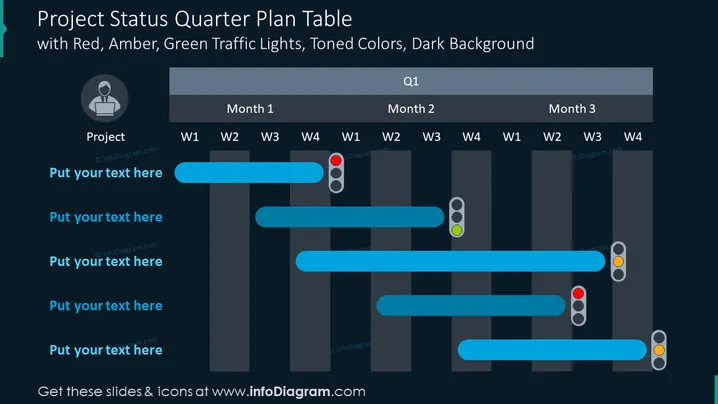
Diese Folie zeigt einen Überblick über den Projektstatus für einen vierteljährlichen Plan in Form eines Gantt-Diagramms. Jede Projektaufgabe wird durch einen horizontalen Balken dargestellt, der den Zeitrahmen über drei Monate hinweg zeigt, unterteilt in Wochen (W1-W4). Der Status jeder Aufgabe wird durch Ampelfarben angezeigt: Rot für kritische Probleme, Gelb für Warnungen und Grün für im Plan. Dieses visuelle System ermöglicht ein schnelles Überwachen des Projektfortschritts und hebt Bereiche hervor, die Aufmerksamkeit benötigen.
Das Gesamtbild der Folie ist schlank und modern, mit einem klaren, leicht nachvollziehbaren Layout. Die Verwendung von Ampelfarben vor dem dunklen Hintergrund und die türkisfarbenen Akzente erzeugen ein auffälliges und funktionales Design.


