

Your graphics add a nice touch to my presentations and I recently used them for one of my all-hands meetings. Your toolbox adds professionalism to my slides. Instead of using standard clipart.
Claude Jones, Director of Engineer, @Walmartlabs, USA

Your graphics add a nice touch to my presentations and I recently used them for one of my all-hands meetings. Your toolbox adds professionalism to my slides. Instead of using standard clipart.
Claude Jones, Director of Engineer, @Walmartlabs, USA
I needed a fresh look at some of my slides. I've tried to find a way to create a paintbrush effect, to underline, accentuate, add some color and the handwritten markers were just the things. Very easy to use, easy to size, change the color. It was an affordable, perfect solution and I'm happy to recommend it.
Anonymous, US
The crisp, clean look of the graphics, and the fact that it allowed me to easily edit and change the colors to match the template was my main reason for purchasing them.
Brandie Jenkins, E-learning Developer, USA
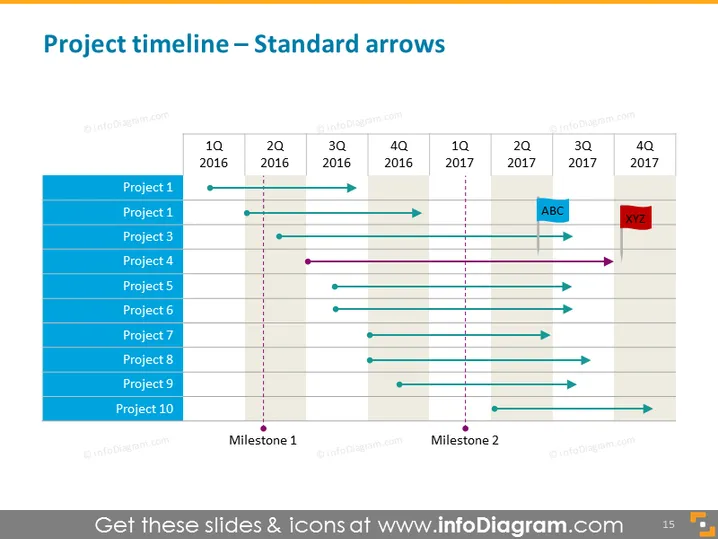
Die PowerPoint-Folie präsentiert einen "Projektzeitplan", der standardisierte Pfeile verwendet, um die Dauer und Phasen verschiedener Projekte über einen Zeitraum von zwei Jahren von 2016 bis 2017 darzustellen. Jedes Projekt ist an der vertikalen Achse aufgelistet, wobei zehn Projekte angezeigt werden. Die horizontale Achse repräsentiert die Zeit, aufgeteilt in Quartale (Q1 bis Q4) für jedes Jahr. Es gibt Markierungen mit den Bezeichnungen "Meilenstein 1" und "Meilenstein 2", die wichtige Punkte oder Ereignisse signalisieren. Einige Projekte beginnen und enden im selben Jahr, während andere sich über die beiden Jahre erstrecken und mit einem Pfeilkopf enden.
Das Folien-design ist sauber und professionell, mit einer einfachen Anordnung, die leicht zu verfolgen ist. Der Einsatz von Farben unterscheidet effektiv verschiedene Elemente und lenkt die Aufmerksamkeit auf wichtige Punkte im Zeitstrahl.



