

Your graphics add a nice touch to my presentations and I recently used them for one of my all-hands meetings. Your toolbox adds professionalism to my slides. Instead of using standard clipart.
Claude Jones, Director of Engineer, @Walmartlabs, USA

Your graphics add a nice touch to my presentations and I recently used them for one of my all-hands meetings. Your toolbox adds professionalism to my slides. Instead of using standard clipart.
Claude Jones, Director of Engineer, @Walmartlabs, USA
I needed a fresh look at some of my slides. I've tried to find a way to create a paintbrush effect, to underline, accentuate, add some color and the handwritten markers were just the things. Very easy to use, easy to size, change the color. It was an affordable, perfect solution and I'm happy to recommend it.
Anonymous, US
The crisp, clean look of the graphics, and the fact that it allowed me to easily edit and change the colors to match the template was my main reason for purchasing them.
Brandie Jenkins, E-learning Developer, USA
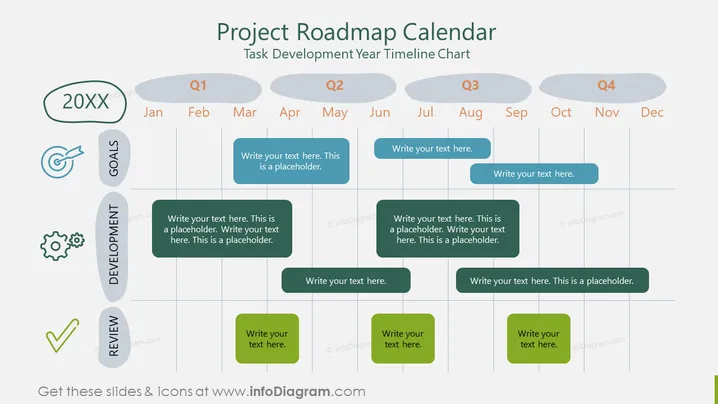
Die Folie mit dem Titel "Projekt-Roadmap-Kalender" ist ein Zeitstrahldiagramm zur Aufgabenentwicklung für ein Jahr, das es den Nutzern ermöglicht, den Zeitrahmen eines Projekts über ein Jahr hinweg zu visualisieren. Sie ist in Quartale (Q1, Q2, Q3, Q4) und Monate von Januar bis Dezember unterteilt. Jedes Quartal enthält Platzhalter für Text, die darauf hinweisen, dass die Nutzer spezifische Aufgaben oder Meilensteine für diesen Zeitraum näher beschreiben können. Links gibt es drei vertikale Kategorien mit den Namen "Ziele", "Entwicklung" und "Überprüfung", gefolgt von einem entsprechenden Icon und einem Raum für zusätzliche Informationen neben der vierteljährlichen Planung.
Die Folie hat ein sauberes, professionelles Erscheinungsbild, das Organisation und Klarheit betont. Eine neutrale Farbpalette bietet einen strukturierten Hintergrund für benutzerdefinierte Inhalte, wodurch die Informationen leicht verdaulich werden.



