
Your graphics add a nice touch to my presentations and I recently used them for one of my all-hands meetings. Your toolbox adds professionalism to my slides. Instead of using standard clipart.
Claude Jones, Director of Engineer, @Walmartlabs, USA
Your graphics add a nice touch to my presentations and I recently used them for one of my all-hands meetings. Your toolbox adds professionalism to my slides. Instead of using standard clipart.
Claude Jones, Director of Engineer, @Walmartlabs, USA
I needed a fresh look at some of my slides. I've tried to find a way to create a paintbrush effect, to underline, accentuate, add some color and the handwritten markers were just the things. Very easy to use, easy to size, change the color. It was an affordable, perfect solution and I'm happy to recommend it.
Anonymous, US
The crisp, clean look of the graphics, and the fact that it allowed me to easily edit and change the colors to match the template was my main reason for purchasing them.
Brandie Jenkins, E-learning Developer, USA
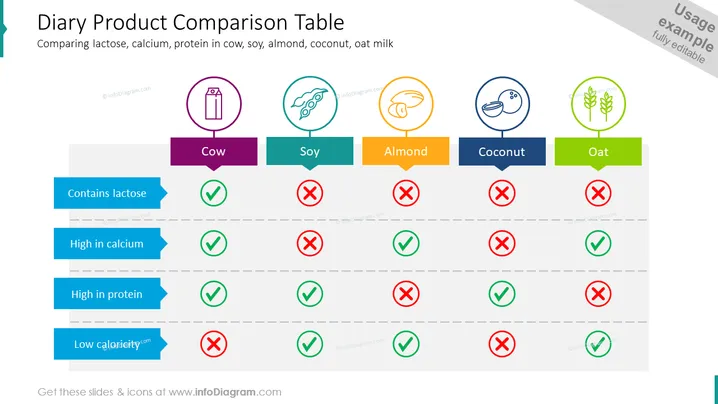
Die Folie präsentiert eine vergleichende Analyse verschiedener Milch- und pflanzlicher Milchprodukte hinsichtlich ihres Nährstoffgehalts: Kuhmilch, Sojamilch, Mandeldrink, Kokosmilch und Hafermilch. Die verglichenen Merkmale dieser Produkte sind Laktosegehalt, Kalzium, Protein und Kalorienanzahl. Kuhmilch enthält Laktose und ist reich an Kalzium und Protein, aber nicht kalorienarm. Sojamilch hat keinen Laktosegehalt, ist proteinreich und kalorienarm, hat jedoch zu wenig Kalzium. Mandeldrink ist nur kalorienarm, während Kokosmilch die Eigenschaften von Soja teilt, jedoch nicht proteinreich ist. Hafermilch zeichnet sich durch einen hohen Kalziumgehalt und einen niedrigen Kaloriengehalt aus, enthält jedoch weder Laktose noch ist sie proteinreich.
Der Gesamteindruck der Folie ist strukturiert und farbenfroh, mit einer klaren visuellen Hierarchie, die den Blick des Betrachters von den Milcharten zu den entsprechenden Merkmalen mit einfachen symbolischen Darstellungen lenkt.




