

Your graphics add a nice touch to my presentations and I recently used them for one of my all-hands meetings. Your toolbox adds professionalism to my slides. Instead of using standard clipart.
Claude Jones, Director of Engineer, @Walmartlabs, USA

Your graphics add a nice touch to my presentations and I recently used them for one of my all-hands meetings. Your toolbox adds professionalism to my slides. Instead of using standard clipart.
Claude Jones, Director of Engineer, @Walmartlabs, USA
I needed a fresh look at some of my slides. I've tried to find a way to create a paintbrush effect, to underline, accentuate, add some color and the handwritten markers were just the things. Very easy to use, easy to size, change the color. It was an affordable, perfect solution and I'm happy to recommend it.
Anonymous, US
The crisp, clean look of the graphics, and the fact that it allowed me to easily edit and change the colors to match the template was my main reason for purchasing them.
Brandie Jenkins, E-learning Developer, USA
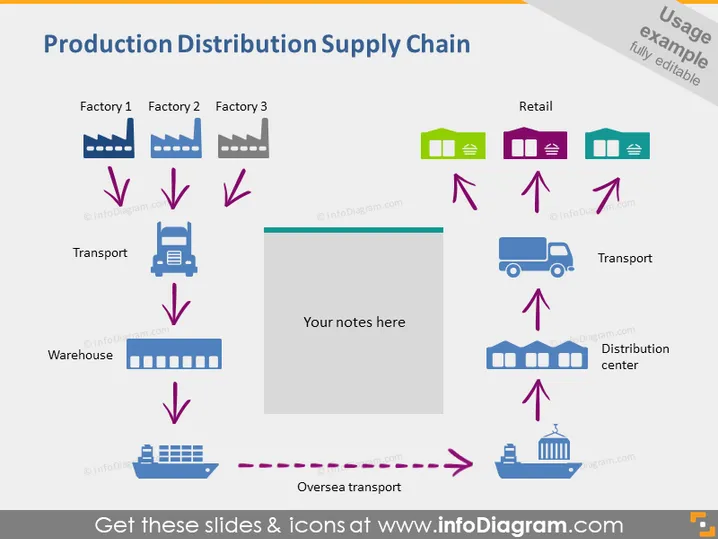
Die PowerPoint-Folie veranschaulicht die Stufen einer Produktionsverteilung Versorgungskette und zeigt Symbole und Text, die Fabriken, Transportmittel, ein Lagerhaus, ein Verteilzentrum und Einzelhandelsgeschäfte repräsentieren. Jede Fabrik ist nummeriert und die Prozesskette wird von den Fabriken ausgehend dargestellt, die sowohl über Land als auch über See bis zur Einzelhandelsphase führt. Textbezeichnungen wie "Fabrik 1," "Transport," "Lagerhaus" und "Einzelhandel" bieten eine klare Identifizierung der einzelnen Komponenten der Versorgungskette und zeigen den Fluss der Waren von der Produktion zum Verbraucher.
Der gesamte Look ist klar und strukturiert, mit klaren visuellen Darstellungen für jeden Schritt der Versorgungskette. Die Verwendung von bunten Symbolen und Pfeilen schafft einen leicht nachvollziehbaren Fluss von der Produktion zum Einzelhandel und visualisiert das Konzept einer Versorgungskette effektiv.



