Your graphics add a nice touch to my presentations and I recently used them for one of my all-hands meetings. Your toolbox adds professionalism to my slides. Instead of using standard clipart.
Claude Jones, Director of Engineer, @Walmartlabs, USA
Your graphics add a nice touch to my presentations and I recently used them for one of my all-hands meetings. Your toolbox adds professionalism to my slides. Instead of using standard clipart.
Claude Jones, Director of Engineer, @Walmartlabs, USA
I needed a fresh look at some of my slides. I've tried to find a way to create a paintbrush effect, to underline, accentuate, add some color and the handwritten markers were just the things. Very easy to use, easy to size, change the color. It was an affordable, perfect solution and I'm happy to recommend it.
Anonymous, US
The crisp, clean look of the graphics, and the fact that it allowed me to easily edit and change the colors to match the template was my main reason for purchasing them.
Brandie Jenkins, E-learning Developer, USA
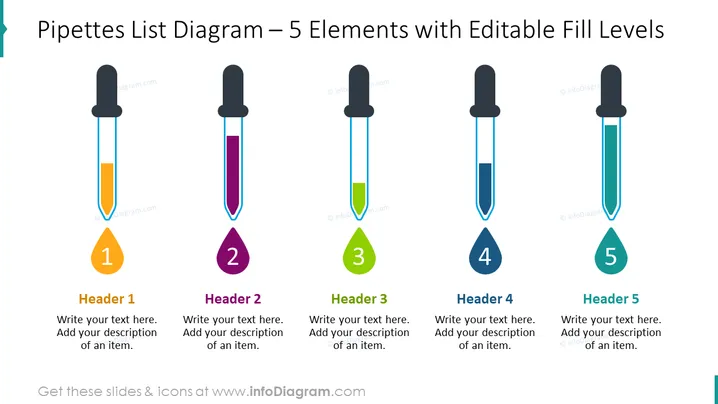
Stellen Sie eine Liste von 5 Elementen mit innovativen Illustrationen von Pipetten dar, die mit bunten Flüssigkeiten auf unterschiedlichen Füllständen gefüllt sind. Jede Illustration ist bearbeitbar, sodass Sie den Füllstand eines beliebigen Metriks genau darstellen können, den Sie mit anderen vergleichen möchten. Fügen Sie Ihre Beschreibungen und Titel hinzu, und Ihre Infografik ist bereit.
Dieses Pipettenliste Diagramm für fünf Elemente mit bearbeitbaren Füllständen Infografik ist Teil unserer Chemielabor-Testglas-PPT-Vorlage.


