Your graphics add a nice touch to my presentations and I recently used them for one of my all-hands meetings. Your toolbox adds professionalism to my slides. Instead of using standard clipart.
Claude Jones, Director of Engineer, @Walmartlabs, USA
Your graphics add a nice touch to my presentations and I recently used them for one of my all-hands meetings. Your toolbox adds professionalism to my slides. Instead of using standard clipart.
Claude Jones, Director of Engineer, @Walmartlabs, USA
I needed a fresh look at some of my slides. I've tried to find a way to create a paintbrush effect, to underline, accentuate, add some color and the handwritten markers were just the things. Very easy to use, easy to size, change the color. It was an affordable, perfect solution and I'm happy to recommend it.
Anonymous, US
The crisp, clean look of the graphics, and the fact that it allowed me to easily edit and change the colors to match the template was my main reason for purchasing them.
Brandie Jenkins, E-learning Developer, USA
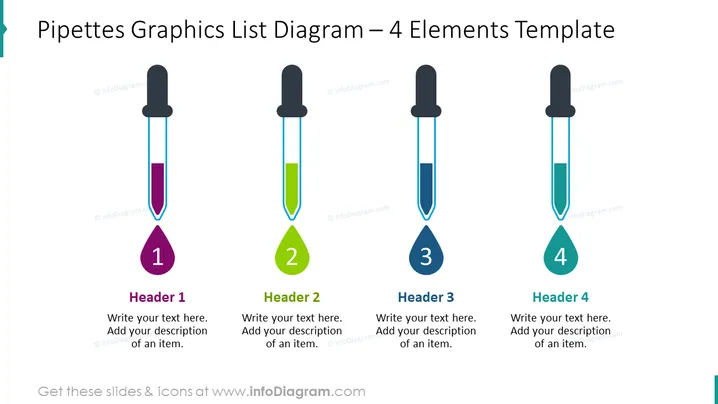
Die Folie zeigt ein "Pipetten Grafik Liste Diagramm" mit 4 Elementen, die jeweils durch eine Pipette mit einem verschiedenfarbigen Tropfen dargestellt werden. Die Zahlen 1 bis 4 sind auf den farbigen Tropfen hervorgehoben und zeigen die Reihenfolge oder Priorität an. Neben jeder Grafik gibt es Platz für einen Titel und ein bearbeitbares Textfeld, das für eine detaillierte Beschreibung gedacht ist und zur Erklärung einzelner Komponenten eines Prozesses, Merkmale eines Produkts oder bestimmter Schlüsselpunkte in einer Präsentation verwendet werden kann. Diese Elemente überbrücken die Lücke zwischen visueller Anziehungskraft und informativem Inhalt.
Das Gesamtdesign ist schlank und visuell ansprechend, mit einem guten Einsatz von Farbkontrast und Raum, der es ermöglicht, jedes Element leicht zu unterscheiden. Die einfachen Symbole kombiniert mit den Textbereichen bieten eine klare und organisierte Möglichkeit, Informationen zu präsentieren.


