
Your graphics add a nice touch to my presentations and I recently used them for one of my all-hands meetings. Your toolbox adds professionalism to my slides. Instead of using standard clipart.
Claude Jones, Director of Engineer, @Walmartlabs, USA

Your graphics add a nice touch to my presentations and I recently used them for one of my all-hands meetings. Your toolbox adds professionalism to my slides. Instead of using standard clipart.
Claude Jones, Director of Engineer, @Walmartlabs, USA

I needed a fresh look at some of my slides. I've tried to find a way to create a paintbrush effect, to underline, accentuate, add some color and the handwritten markers were just the things. Very easy to use, easy to size, change the color. It was an affordable, perfect solution and I'm happy to recommend it.
Anonymous, US
The crisp, clean look of the graphics, and the fact that it allowed me to easily edit and change the colors to match the template was my main reason for purchasing them.
Brandie Jenkins, E-learning Developer, USA
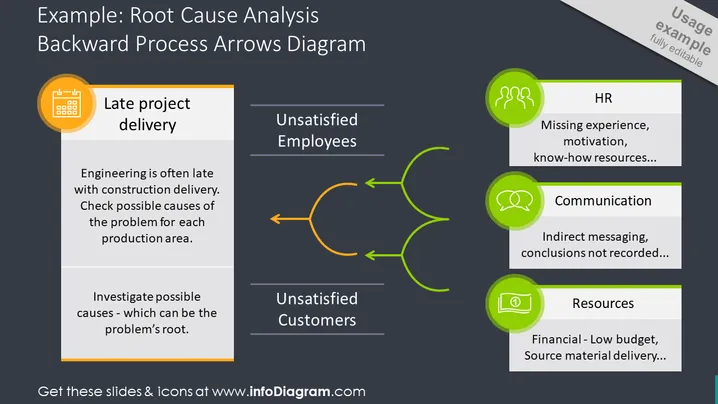
Die PowerPoint-Folie mit dem Titel "Beispiel: Rückwärtsprozess Pfeildiagramm zur Ursachenanalyse" präsentiert eine Methode zur Identifizierung der Grundursachen eines Problems in einem Projekt oder Prozess. Die Folie skizziert ein Problem mit "Verspäteter Projektabgabe" und hebt zwei zentrale Folgewirkungen hervor: "Unzufriedene Mitarbeiter" und "Unzufriedene Kunden." Jede Wirkung ist mit potenziellen Grundursachen verbunden, die als HR, Kommunikation und Ressourcen gekennzeichnet sind. Das HR-Problem betrifft fehlende Erfahrung und Motivation, die Kommunikation adressiert indirekte Botschaften, und die Ressourcen beziehen sich auf finanzielle Einschränkungen und Herausforderungen bei der Lieferung von Materialien. All diese Elemente sind durch rückwärts gerichtete Pfeile miteinander verbunden, die den Untersuchungsprozess von den Auswirkungen zu den Ursachen signalisieren.


