

Your graphics add a nice touch to my presentations and I recently used them for one of my all-hands meetings. Your toolbox adds professionalism to my slides. Instead of using standard clipart.
Claude Jones, Director of Engineer, @Walmartlabs, USA

Your graphics add a nice touch to my presentations and I recently used them for one of my all-hands meetings. Your toolbox adds professionalism to my slides. Instead of using standard clipart.
Claude Jones, Director of Engineer, @Walmartlabs, USA
I needed a fresh look at some of my slides. I've tried to find a way to create a paintbrush effect, to underline, accentuate, add some color and the handwritten markers were just the things. Very easy to use, easy to size, change the color. It was an affordable, perfect solution and I'm happy to recommend it.
Anonymous, US
The crisp, clean look of the graphics, and the fact that it allowed me to easily edit and change the colors to match the template was my main reason for purchasing them.
Brandie Jenkins, E-learning Developer, USA
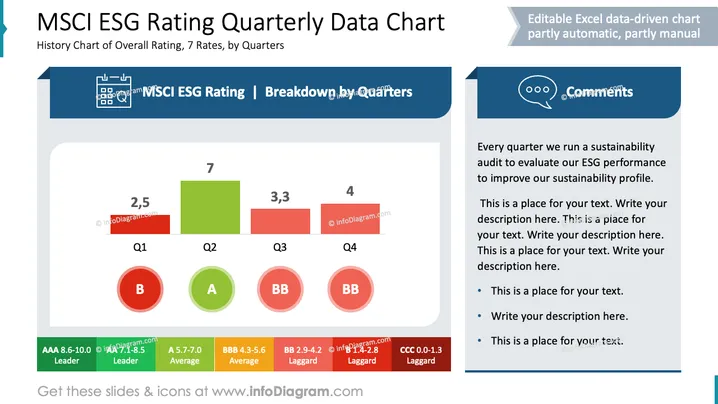
Die Folie veranschaulicht das "MSCI ESG-Rating Quartalsdaten Diagramm" und beschreibt die Historie der Gesamtbewertungen durch sieben Raten in Quartalen. Es beinhaltet eine quartalsmäßige Punkte-Visualisierung von Q1 bis Q4, die einen signifikanten Anstieg im Q2 zeigt. Der Kommentarteil bietet einen Platz zum Analysieren von ESG-Leistungskennzahlen, um die Nachhaltigkeitsprofile im Laufe der Zeit zu verbessern. Eine Bewertungsliste klassifiziert die Noten von 'AAA' (Führer) bis 'CCC' (Nachzügler).
Die Folie ist ordentlich organisiert mit visuell unterscheidbaren Abschnitten. Der Einsatz von Farben korrespondiert effektiv mit der Bewertungsskala und verbessert die Klarheit.



