

Your graphics add a nice touch to my presentations and I recently used them for one of my all-hands meetings. Your toolbox adds professionalism to my slides. Instead of using standard clipart.
Claude Jones, Director of Engineer, @Walmartlabs, USA

Your graphics add a nice touch to my presentations and I recently used them for one of my all-hands meetings. Your toolbox adds professionalism to my slides. Instead of using standard clipart.
Claude Jones, Director of Engineer, @Walmartlabs, USA
I needed a fresh look at some of my slides. I've tried to find a way to create a paintbrush effect, to underline, accentuate, add some color and the handwritten markers were just the things. Very easy to use, easy to size, change the color. It was an affordable, perfect solution and I'm happy to recommend it.
Anonymous, US
The crisp, clean look of the graphics, and the fact that it allowed me to easily edit and change the colors to match the template was my main reason for purchasing them.
Brandie Jenkins, E-learning Developer, USA
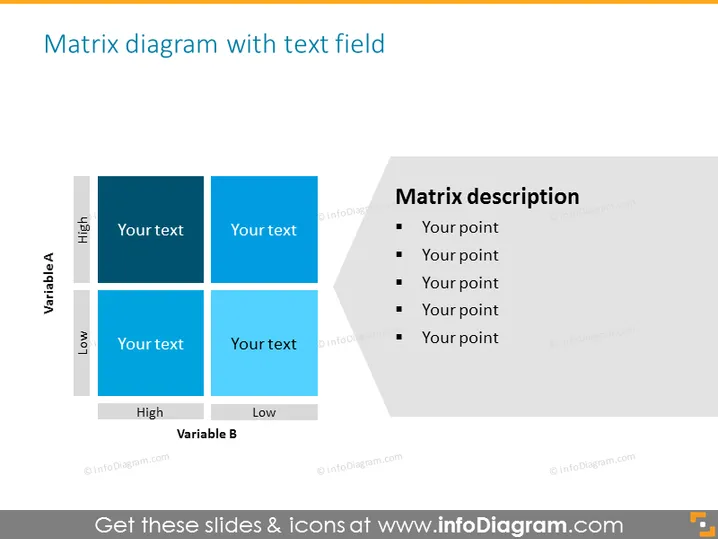
Die Folie zeigt ein 2x2-Matrixdiagramm, das ein strategisches Management-Tool darstellt, das helfen kann, Informationen basierend auf zwei Variablen zu kategorisieren oder zu organisieren: Variable A von Niedrig bis Hoch und Variable B von Hoch bis Niedrig. Jedes Quadrat bietet einen Platzhalter für benutzerdefinierten Text, was impliziert, dass spezifische Details oder Konzepte anhand ihrer Position entlang der beiden Achsen beschrieben werden können. Die rechte Seite enthält einen Abschnitt "Matrixbeschreibung", der eine weitergehende Ausführung zu Punkten vorschlägt, die für das Diagramm relevant sind.
Die Folie ist sauber und professionell, mit einer klaren Abgrenzung zwischen dem Matrixdiagramm und seinen beschreibenden Elementen, wobei kontrastreiche Farben und ein organisiertes Layout effektiv genutzt werden. Das Design erleichtert eine fokussierte Präsentation von Daten oder strategischen Konzepten mithilfe eines Matrixrahmens.



