Your graphics add a nice touch to my presentations and I recently used them for one of my all-hands meetings. Your toolbox adds professionalism to my slides. Instead of using standard clipart.
Claude Jones, Director of Engineer, @Walmartlabs, USA
Your graphics add a nice touch to my presentations and I recently used them for one of my all-hands meetings. Your toolbox adds professionalism to my slides. Instead of using standard clipart.
Claude Jones, Director of Engineer, @Walmartlabs, USA
I needed a fresh look at some of my slides. I've tried to find a way to create a paintbrush effect, to underline, accentuate, add some color and the handwritten markers were just the things. Very easy to use, easy to size, change the color. It was an affordable, perfect solution and I'm happy to recommend it.
Anonymous, US
The crisp, clean look of the graphics, and the fact that it allowed me to easily edit and change the colors to match the template was my main reason for purchasing them.
Brandie Jenkins, E-learning Developer, USA
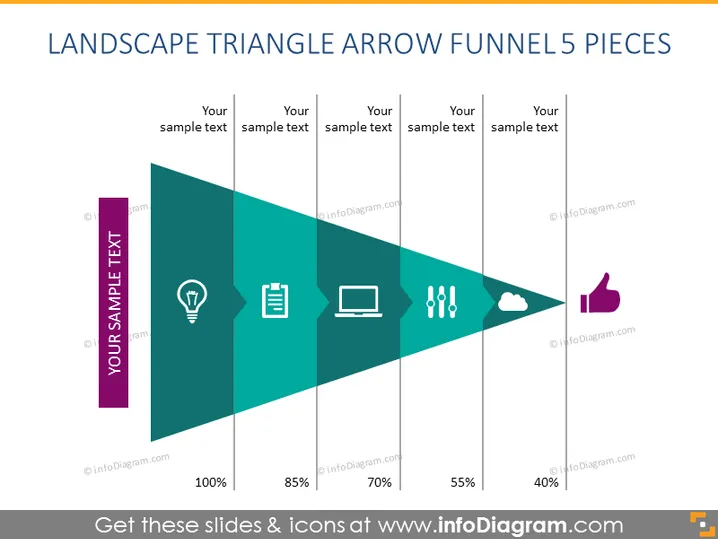
Die Folie zeigt ein Prozessdiagramm mit fünf Phasen in Form eines nach rechts gerichteten Pfeils, wobei jede Phase schmaler als die vorherige ist, um einen Trichtereffekt darzustellen. Es zeigt einen Fortschritt oder eine Reduktion mit Prozentsätzen und hat Symbole, die verschiedene Konzepte symbolisieren: eine Glühbirne für Ideen, ein Clipboard für Dokumentation, einen Laptop für Technologie oder Aufgaben, eine Gruppe von Punkten für Prozesse oder Fluss und eine Wolke mit einem Daumen nach oben für positive Ergebnisse oder Cloud-Lösungen. Jede Phase ist mit "Ihr Beispieltext" beschriftet, um mit spezifischen Informationen angepasst zu werden.
Das Gesamtbild ist modern und professionell, mit einem klaren Design, das Farbverläufe und klare Symbole verwendet, um verschiedene Phasen oder Konzepte darzustellen. Die Nutzung von Raum und grafischen Elementen macht die Informationen auf einen Blick leicht erkennbar.


