
Your graphics add a nice touch to my presentations and I recently used them for one of my all-hands meetings. Your toolbox adds professionalism to my slides. Instead of using standard clipart.
Claude Jones, Director of Engineer, @Walmartlabs, USA

Your graphics add a nice touch to my presentations and I recently used them for one of my all-hands meetings. Your toolbox adds professionalism to my slides. Instead of using standard clipart.
Claude Jones, Director of Engineer, @Walmartlabs, USA

I needed a fresh look at some of my slides. I've tried to find a way to create a paintbrush effect, to underline, accentuate, add some color and the handwritten markers were just the things. Very easy to use, easy to size, change the color. It was an affordable, perfect solution and I'm happy to recommend it.
Anonymous, US
The crisp, clean look of the graphics, and the fact that it allowed me to easily edit and change the colors to match the template was my main reason for purchasing them.
Brandie Jenkins, E-learning Developer, USA
Inhalt:
Icon-Ideen zur Darstellung dieser Konzepte:
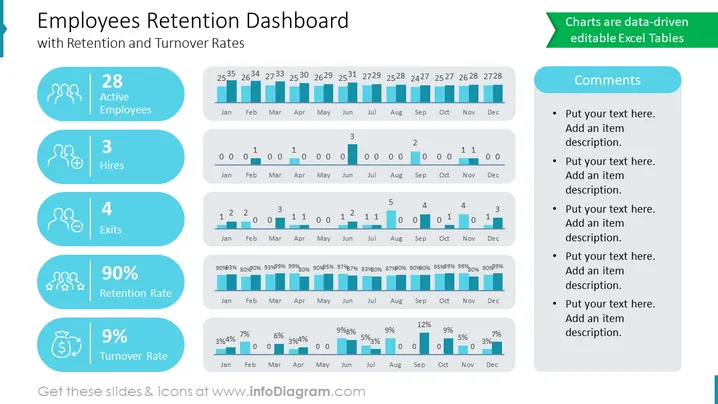
Die Bindungs- und Abwanderungsraten von Mitarbeitern sind wichtige Kennzahlen für Unternehmen. Eine hohe Bindungsrate zeigt, dass die Mitarbeiter mit ihren Jobs zufrieden sind und mit dem Unternehmen bleiben wollen. Eine niedrige Abwanderungsrate bedeutet, dass das Unternehmen nicht viel Geld für die Rekrutierung und Schulung neuer Mitarbeiter ausgibt.
Unternehmen können die Informationen auf dem Dashboard zur Mitarbeiterbindung nutzen, um Bereiche zu identifizieren, in denen sie die Zufriedenheit der Mitarbeiter verbessern und die Abwanderung reduzieren können. Wenn ein Unternehmen beispielsweise feststellt, dass es in einer bestimmten Abteilung eine hohe Abwanderungsrate gibt, kann es die Gründe dafür untersuchen und Maßnahmen ergreifen, um diese zu beheben.


