Your graphics add a nice touch to my presentations and I recently used them for one of my all-hands meetings. Your toolbox adds professionalism to my slides. Instead of using standard clipart.
Claude Jones, Director of Engineer, @Walmartlabs, USA
Your graphics add a nice touch to my presentations and I recently used them for one of my all-hands meetings. Your toolbox adds professionalism to my slides. Instead of using standard clipart.
Claude Jones, Director of Engineer, @Walmartlabs, USA
I needed a fresh look at some of my slides. I've tried to find a way to create a paintbrush effect, to underline, accentuate, add some color and the handwritten markers were just the things. Very easy to use, easy to size, change the color. It was an affordable, perfect solution and I'm happy to recommend it.
Anonymous, US
The crisp, clean look of the graphics, and the fact that it allowed me to easily edit and change the colors to match the template was my main reason for purchasing them.
Brandie Jenkins, E-learning Developer, USA
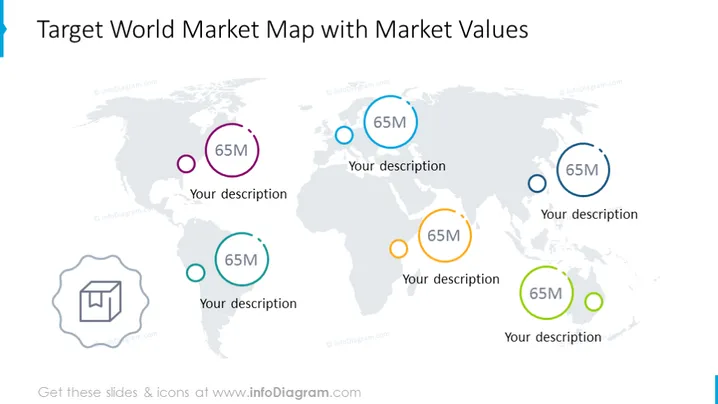
Diese PowerPoint-Folie bietet einen Überblick über die Marktwerte in verschiedenen Regionen der Welt. Jede Region ist mit einem unterschiedlich gefärbten Kreis hervorgehoben und mit einem Wert "65M" verbunden, der eine numerische Darstellung, vermutlich der Marktgröße oder des Potenzials, anzeigt. Unter jedem Kreis befindet sich ein Platzhaltertext mit der Bezeichnung "Ihre Beschreibung", was darauf hindeutet, dass der Präsentator spezifische Details zu jeder Region, wie beispielsweise Marktmerkmale oder Geschäftsleistungsindikatoren, bereitstellen sollte.
Das Design der Folie ist sauber und modern, mit einer gedämpften Farbpalette, die es den lebendigen Marktwertkreisen ermöglicht, hervorzuheben. Die Verwendung von Symbolen und Textplatzhaltern fördert die Anpassungsfähigkeit und Anpassbarkeit an die Bedürfnisse des Präsentators.


