Your graphics add a nice touch to my presentations and I recently used them for one of my all-hands meetings. Your toolbox adds professionalism to my slides. Instead of using standard clipart.
Claude Jones, Director of Engineer, @Walmartlabs, USA
Your graphics add a nice touch to my presentations and I recently used them for one of my all-hands meetings. Your toolbox adds professionalism to my slides. Instead of using standard clipart.
Claude Jones, Director of Engineer, @Walmartlabs, USA
I needed a fresh look at some of my slides. I've tried to find a way to create a paintbrush effect, to underline, accentuate, add some color and the handwritten markers were just the things. Very easy to use, easy to size, change the color. It was an affordable, perfect solution and I'm happy to recommend it.
Anonymous, US
The crisp, clean look of the graphics, and the fact that it allowed me to easily edit and change the colors to match the template was my main reason for purchasing them.
Brandie Jenkins, E-learning Developer, USA
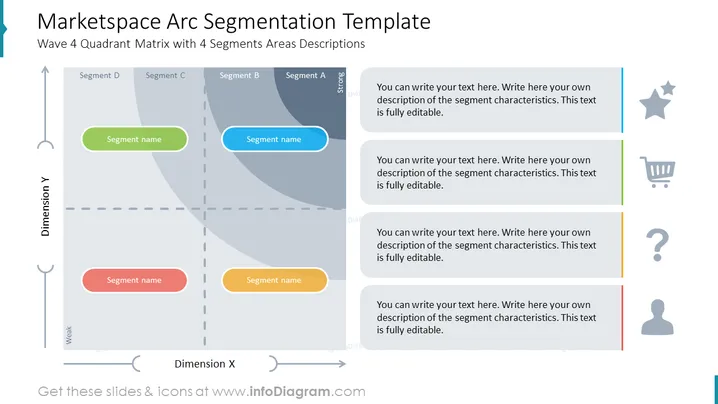
Die Folie stellt eine "Marktsegmentierungs-Arc-Vorlage" vor, die eine Welle-4-Quadrantenmatrix mit Beschreibungen für 4 Segmentbereiche hervorhebt. Jeder Bereich in der Matrix repräsentiert ein unterschiedliches Segment (A, B, C, D), das potenziell unterschiedliche Ebenen von zwei Metriken, Dimension X und Dimension Y, signalisiert, wobei Segmente als stark oder schwach kategorisiert werden können. Benutzer können den bereitgestellten Beschreibungstext für jedes Segment bearbeiten, um Anpassungen vorzunehmen, die den spezifischen Marktanalysen entsprechen. Dies ist ideal, um Marktsegmente basierend auf zwei unterschiedlichen Dimensionen oder Faktoren zu visualisieren.
Das Gesamtbild der Folie ist sauber und geschäftlich, mit einer Mischung aus visuellen Elementen und Text, die eine umfassende Segmentierungsanalyse ermöglichen. Der Einsatz von Farben und Symbolen trägt zur visuellen Anziehungskraft bei und hilft, Konzepte schnell und effektiv zu kommunizieren.


