

Your graphics add a nice touch to my presentations and I recently used them for one of my all-hands meetings. Your toolbox adds professionalism to my slides. Instead of using standard clipart.
Claude Jones, Director of Engineer, @Walmartlabs, USA

Your graphics add a nice touch to my presentations and I recently used them for one of my all-hands meetings. Your toolbox adds professionalism to my slides. Instead of using standard clipart.
Claude Jones, Director of Engineer, @Walmartlabs, USA
I needed a fresh look at some of my slides. I've tried to find a way to create a paintbrush effect, to underline, accentuate, add some color and the handwritten markers were just the things. Very easy to use, easy to size, change the color. It was an affordable, perfect solution and I'm happy to recommend it.
Anonymous, US
The crisp, clean look of the graphics, and the fact that it allowed me to easily edit and change the colors to match the template was my main reason for purchasing them.
Brandie Jenkins, E-learning Developer, USA
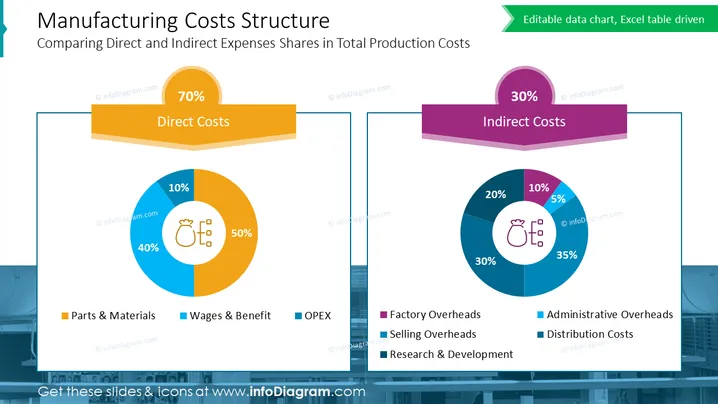
Die Folie mit dem Titel „Struktur der Fertigungskosten“ vergleicht die Anteile der direkten und indirekten Ausgaben an den gesamten Produktionskosten. Auf der linken Seite werden die direkten Kosten als 70 % der Gesamtkosten dargestellt, mit einer Aufschlüsselung von 50 % Teile & Materialien, 40 % Löhne & Leistungen und 10 % OPEX, was die greifbaren Produktionskosten wie Materialien und Arbeitskräfte angibt. Auf der rechten Seite machen die indirekten Kosten 30 % aus, mit einer Aufschlüsselung von 35 % Verwaltungsgemeinkosten, 30 % Fabrikgemeinkosten, 20 % Vertriebsgemeinkosten und 10 % Forschung & Entwicklung, was die Kosten darstellt, die nicht direkt an den Herstellungsprozess gebunden sind, wie Management- und Vertriebsaufwände.
Die Folie hat ein klares und professionelles Design mit einem Gleichgewicht zwischen grafischen Elementen und Informationen. Die kontrastierenden Farben und klaren Beschriftungen machen sie optisch ansprechend und auf einen Blick leicht verständlich.



