

Your graphics add a nice touch to my presentations and I recently used them for one of my all-hands meetings. Your toolbox adds professionalism to my slides. Instead of using standard clipart.
Claude Jones, Director of Engineer, @Walmartlabs, USA

Your graphics add a nice touch to my presentations and I recently used them for one of my all-hands meetings. Your toolbox adds professionalism to my slides. Instead of using standard clipart.
Claude Jones, Director of Engineer, @Walmartlabs, USA
I needed a fresh look at some of my slides. I've tried to find a way to create a paintbrush effect, to underline, accentuate, add some color and the handwritten markers were just the things. Very easy to use, easy to size, change the color. It was an affordable, perfect solution and I'm happy to recommend it.
Anonymous, US
The crisp, clean look of the graphics, and the fact that it allowed me to easily edit and change the colors to match the template was my main reason for purchasing them.
Brandie Jenkins, E-learning Developer, USA
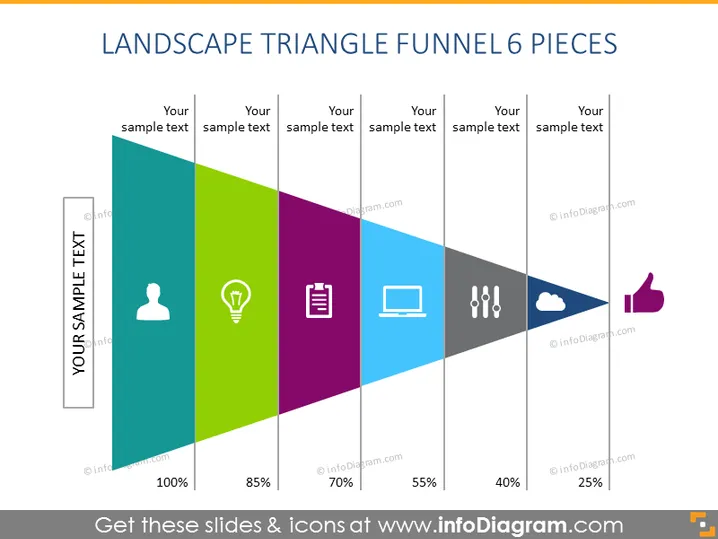
Die Folie visualisiert einen Prozess durch einen Trichter mit sechs Segmenten, die mit 'Ihr Beispieltext' beschriftet sind und entsprechende Prozentsätze von 100 % bis 25 % anzeigen. Jedes Segment ist mit einem Symbol assoziiert: einer Person, einer Glühbirne, einer Dokumentenliste, einem Laptop, Ausrufezeichen und einer Wolke, die wahrscheinlich verschiedene Stufen oder Elemente wie Lead-Akquise, Ideenfindung, Dokumentation, technischen Prozess, kritische Bewertung und Cloud-Dienste darstellen. Das letzte Segment weist auf ein Daumen-hoch-Symbol hin, das normalerweise Zustimmung oder Abschluss symbolisiert.



